
1. Outlier, an Outsider!
Outliers, also referred to as anomaly, exception, irregularity, deviation, oddity, arise in data analysis when the data records differ dramatically from the other observations. In layman’s terms, an outlier can be interpreted as any value that is numerically far-flung from most of the data points in a sample of data.

2. Understanding an Outlier is more important than finding it!
In real world scenarios, we all have come across Outliers in many observations and made such statements as:
- This number is too big. It can’t be right!
- Why are there so many zeros?
- Since everybody else answered the survey with an 8 or a 9, how come this guy put in all 1’s and 2’s?
- If they only earned $300 last year, I don’t care about it.
People tend to believe that numbers tell the story, but the truth being that there underlies a story behind every number! Basically, it is of utmost importance to deal with the outliers in the data pre-processing steps for any kind of data analytics problem statement as a lot of parametric statistics like mean, correlation as well as many machine learning models like Linear Regression, ANOVA, K-Means Clustering, Support Vector Machines to name a few are sensitive to outliers and if not treated well, they may mess up with our data analysis.
3. Dealing with Outliers: A secret ingredient for success of data analysis
Before we get too into the weeds of dealing with Outliers, let’s understand the basis of their occurrence. Some of the major occasions while we come across such data are:
- Mistake in recording, entry or processing (such errors can occur in measurement, in data entry as well as while undergoing sampling.
- Observational Error (for instance, say a balance showing non-zero value even when no weight is placed on it. This might be because of surrounding environment)
- Natural entry (not an error, novelties in data)
The most common techniques to deal with outliers is:
- Remove Outliers
- Replace Outliers
4. Smarten Assisted Predictive Modelling: Take the Guesswork out of Planning!
Every organization must plan and forecast results. If the enterprise is to succeed, it must strive for accuracy and identify trends and patterns in the market and industry that will help it to predict future results, plan for growth and capitalize on opportunities. Smarten Insight provides predictive modeling capability and auto-recommendations and auto-suggestions to simplify use and allow business users to leverage predictive algorithms without the expertise and skill of a data scientist.
5. Become one with the data!
When it comes to data pre-processing, Smarten has provision to suffice the data pre-processing steps intelligently without much of the efforts to be put from the end users. Out of the many data operations taken care of, Smarten has a quick mechanism for handling the outliers from any dataset before the data is provided for any further analysis. Let’s gradually go through the Smarten mechanism for Handling Outliers!
Any kind of analysis initiates by looking upon the data. Keeping a note that we already have a predefined dataset uploaded to Smarten, let’s get started slowly but surely by opening a dataset to be pre-processed using Smarten.
- Steps to Open a loaded dataset in Smarten:
1. Go to Open -> Data in top right drop-down in Smarten
2. Search for the dataset to analyze
3. Examine the dataset
Let’s cite the most trending dataset in today’s date to add flavor to our data processing! Hereby, we shall be dealing with the Covid-19 dataset for daily reported cases for each of the Indian states and the required attributes and carry forward with our study.
On opening the dataset, we will be able to view the attributes (columns) for the ‘Corona_Statewise_India’ dataset and be able to draw some superficial insights.
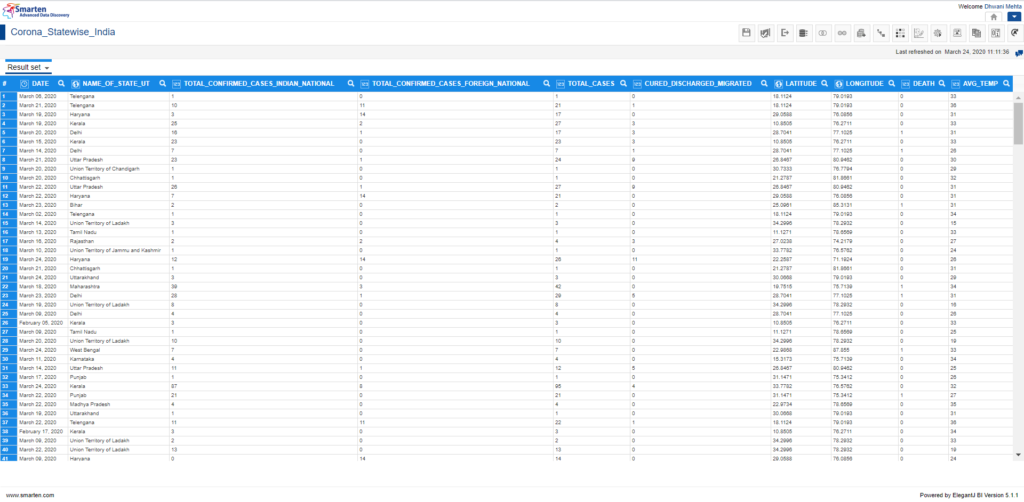
A gaze at the dataset reveals the following attributes of concern:
- Date
- Name_of_State_UT
- Total_Confirmed_cases_Indian_National
- Total_Confirmed_cases_Foreign_National
- Total_Cases
- Cured_Discharged_Migrated
- Latitude
- Longitude
- Death
- Avg_Temp
Considering the above attributes, we can frame handful of use-cases like:
- Predicting Total Covid-19 positive cases in India or Foreign for a given time span
- Forecast the number of cured/discharged/migrated cases from the provided data
- Forecast the number of confirmed cases for a given state or union territory or a given region based upon Latitude and Longitude attributes
- Examine the relationship between Death rate per day based upon average temperature, region and state
- Examine the fluctuations in Total number of Covid-19 positive cases based upon other influencing factors.
In order to build an appropriate predictive model for any data and to obtain satisfactory results, we need to get rid of the outliers beforehand at the data processing stage.
6. What to Do? Let Smarten handle the Out,Liar!
Smarten intelligently handles Outliers in data with the users having to do just a couple of steps.
The highlighted icon depicts the Outlier feature in Smarten:
The next straight-thinking step is to click the outlier icon and to understand what it offers. The following panel opens up on clicking the outlier icon:
The outlier panel provides users an option to select the columns (i.e., attributes) from all the available attributes to process the outliers. Not all the attributes need to be processed and many of the attributes strongly require that the outliers be discarded before proceeding to any further data analysis and operations. So as a user, one must have a basic understanding upon which attributes need to be dealt with. However, Smarten makes this brainstorming task easier by providing an option to the users to by default select all the attributes and then makes provision for further insights which assists the users in designating their set of attributes to be processed.

As indicated in the figure, the + icon besides each attribute in the available column leads them to the selected columns which are to be processed for outlier treatment. Similarly, users have flexibility in removing them from the selected column by the – icon. In case of selecting all the available attributes for outlier processing, ⊕ icon at the top serves the purpose. ⊖ icon serves the purpose of deselecting all the selected attributes. Apart from this, Smarten also has a provision wherein the users can directly search for the attributes to indulge in Outlier handling tasks from the search bar. This essentially helps when there is a huge number of available attributes and users want only a handful of them to be quickly pre-processed.
Upon making the mind on the attributes to be dealt with for Outlier processing, click on the Apply button which leads us to the following window.
In order to reduce the friction in understanding, let’s at first only select one attribute (i.e., Total_Confirmed_cases_Indian_National) and look upon what all Smarten has to provide.

The window is clearly suggesting to us that out of the total number of records in the dataset, 20 records (constituting 5.9% of the total number of records) seems to have been detected as outliers while considering the Total_Confirmed_cases_Indian_National attribute with 100% accuracy!
- How to know the total number of records in our dataset?
Smarten comprises a feature of enable record count which assists us to swiftly know the number of records at any given instance in our dataset. On clicking the icon as demonstrated in the image below, smarten displays the total count of records available at present instance in our dataset.

7. Before thinking about what is on the edges, it is important to think of what lies at the midway! Box plots assists to explain the outlier behavior!
A box plot is a graphical representation of statistical data based on the lower bound, lower quartile, median, upper quartile, and upper bound. On a mouse hover upon the box plot we obtain all of this details for the data of the selected attribute.

The outliers are the data points extending beyond the upper and lower bounds. The red bubble is indicative of the extreme outlier which lies farthest from the median data point. The figure below is indicative of the fact that our data contains a record with 87 cases in Total_Confirmed_cases_Indian_National which is farthest from our stated median value for total cases being 3. This helps the user understand the variability caused in the data and make appropriate decisions to deal with the outlier by either removing them or replacing them.

8. Download and View the Outlier Data
Smarten has a provision wherein the end users can get to download and view the outlier data for the selected attributes by simply clicking on the Click here to download URL.

On clicking the URL to download the data, we are provided with the excel file recording the 20 records detected as the outlier data from our entire dataset for the selected attribute (here Total_Confirmed_cases_Indian_National).

It can be hereby recalled that the outlier data consists of all the records with Total_Confirmed_cases_Indian_National attribute values lying beyond the upper bound (i.e., 29).
9. Shall an outlier be removed or replaced from analysis?
The answer to this is seemingly straightforward but not simple! Sometimes, an outlier can be a genuine data point and in such a scenario removing them will not be a great option. But an outlier may also be a misrepresentation or an error and in such an occasion, it’s wiser to remove them entirely from our data. Also, while making such a strategy, one must also take into consideration the number of outliers in the data, if there is a high quota of outlier data in our dataset, removing them will shrink our data considerably leading to less data for making analysis. In such a context, replacing the outlier offers to be a recommended option. Furthermore, when something unusual happens in our data, something important might have happened to our business! Outliers in such scenarios, empowers us in making meaningful decisions. Say for instance, the number of Covid-19 positive cases has shown an abrupt hike because of businesses and schools reopening. Now this can genuinely be correct data and treating them as outliers and removing them may not allow us to recognize the causes for increase in number of cases. So, such variables shall be retained as it is in our data. The crux of the discussion is that one must be aware of their data and the use-case to be dealt while dealing with the outliers!
Smarten equips us in making the remove and replace operations for outliers easily at one click!

On clicking the Remove Outliers button, we get a confirmation pop-up in order to reconsider our decision. Once made the decision, the records containing outliers in the chosen attributes are totally removed from the dataset and we obtain our processed dataset. One can also check the count of the new dataset obtained by selecting the enable record count feature and note the amount of data loss for the advancing data analysis steps.

On clicking the Replace Outliers button, we obtain confirmation pop-up in order to think over our decision. Smarten replaces the value of the outlier data of the selected attributes with the median value of that attribute. This option retains the data count of the dataset and the user has to make no compromise upon the amount of data provided to the model for further analysis.
10. Better data beats fancier algorithms.
If you are with me so far, and you have done your homework in understanding Outliers and their effect and impact on our data, you might have comprehended that better data does not always mean more data. Though having more data, both in terms of a greater number of records and more features to study is a blessing, one must always invest in directing efforts towards improving the data. Many a times, lot of attempts are made in building fancier algorithms to tackle use-cases in order to attain high accuracy matrix. But a better data shall always beat fancier algorithms so its recommended to get rid of outliers in the initial pre-processing steps so that our algorithms can furnish better outcomes. However, on a closing remark, data is very important for analysis, but data without sound approach is a noise in itself! So, Smarten apart from making a provision in achieving better data, also provides us with sound machine learning algorithms to attain the requisite outcome without taking much of the user’s efforts!
Note: This article is based on Smarten Version 5.1.1. This may or may not be relevant to the Smarten version you may be using.
Original Post : Handling Outliers Using Smarten Assisted Predictive Modelling!
