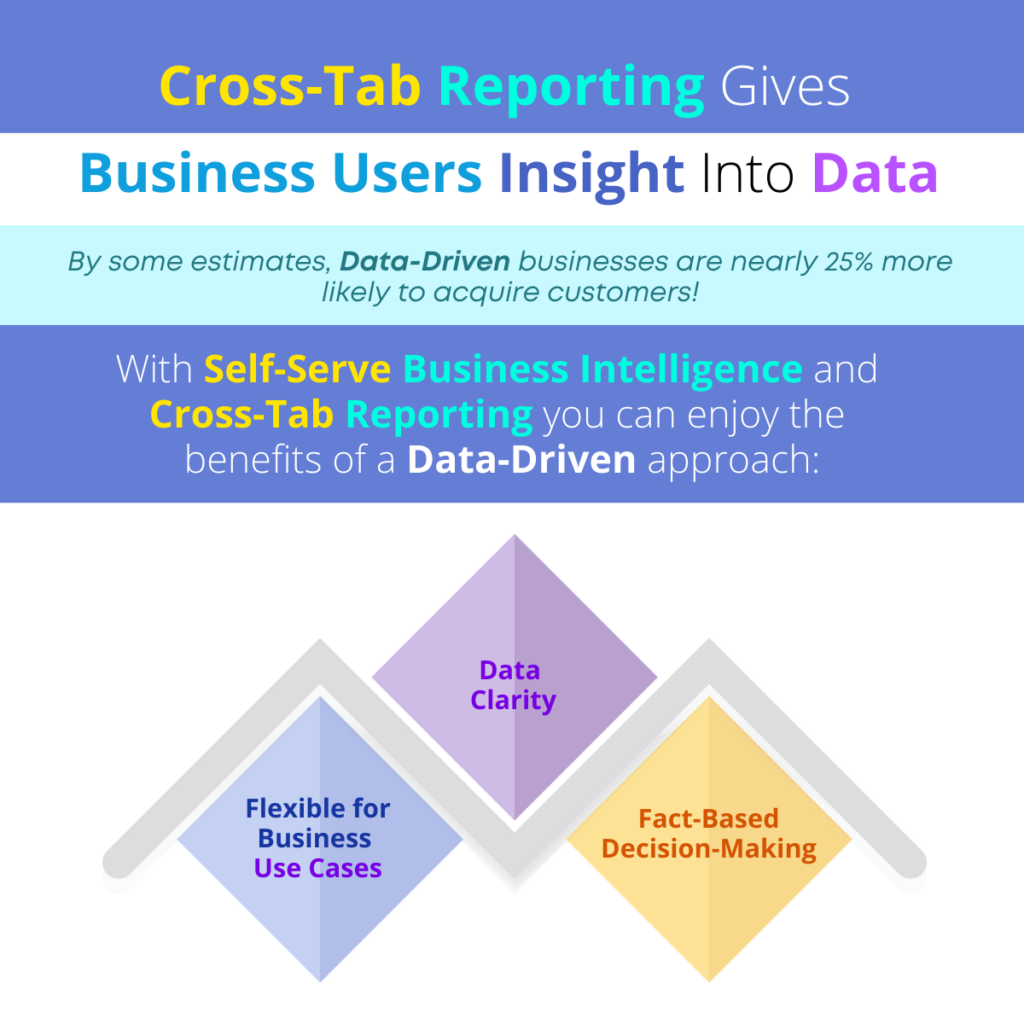
Users Love Self-Serve BI and Cross-Tab Analytics!

Ensure Business Users Will Adopt BI Tools with Self-Serve BI and Cross-Tab Analytics!

Gartner has predicted that, ‘90% of corporate strategies will explicitly mention information as a critical enterprise asset and analytics as an essential competency.’ Establishing the strategy is one thing, but getting business users to adopt an analytics and information-based business workflow is quite another.

‘Modern business intelligence tools that are designed with self-serve features makes it easy enough for every user (no matter their technical skill) to leverage analytics to report, share and collaborate.’

When it comes to teams, there are two things that are always true: 1) they learn a process and workflow and rarely want to change that familiar process and 2) they are always suspicious of ‘new’ initiatives and nearly always believe that these new initiatives will result in more work for them. There is a reason your team resists new processes and initiatives and that reason is simple. Usually, their fears are warranted!

So, if you want to engender support for new analytics initiatives and engage a business community in fact-based, action-oriented initiatives, you need to plan this new initiative with your users in mind.

In this article, we focus on two of the primary components of a new business user analytics initiative.

Enable User Adoption with Self-Serve BI and Cross-Tab Analytics

Self-Serve BI Tools

Modern business intelligence tools that are designed with self-serve features like smart data visualization, self-serve data preparation and assisted predictive modeling make it easy enough for every user (no matter their technical skill) to leverage analytics to report, share and collaborate. By adding value to the user’s everyday tasks and reducing the rework and issues they will confront, you can encourage your users to adopt analytics initiatives.

  • Any promotion of analytics strategy must clearly illustrate business use cases and benefits of these tools.
  • Support a more productive, streamlined environment that will allow them to do more with less and get the job done quickly.
  • Ensure that business users can collaborate and share and grow their own expertise and visibility.
  • Provide measurable results and information to make recommendations and support those recommendations.

Cross-Tab Analytics Capabilities

Those self-serve tools should include reporting and graphical tools that are clear and concise. Business users don’t want tools that produce complex reports filled with columns and mind-numbing numbers that do not help them reach a decision or illustrate an issue. Cross-tab analytics have been around for some time but the new, improved versions of this capability provides real insight into data in a way that is clear for every user. Sophisticated functionality is underpinned with easy-to-use tools so users can analyze the relationship between or among two or more variables and summarize data in rows and columns making it easy to understand the relationships and intersection of the various types of data. Understanding relationships in data is crucial to identifying the root cause of a problem or to targeting an issue or identifying a business opportunity. Your team members can work with multi-dimensional data and perform ad-hoc queries to gain a clear view of performance, dive into your data, and find and understand the data they need quickly and intuitively. Cross-tab analysis simplifies complex data operations, summary operations, time series functions, filters and custom column expressions and enables business users with simple tools they can really use.

‘If you want to engender support for new analytics initiatives and engage a business community in fact-based, action-oriented initiatives, you need to plan this new initiative with your users in mind.’

Business Intelligence tools can improve your business results. If your business understands the challenges of implementing a business intelligence solution and adequately plans for implementation and user adoption, it can leverage the benefits of these tools and solutions and ensure success. Let us help you achieve your vision and improve productivity and insight across the organization.

Original Post : Enable User Adoption with Self-Serve BI and Cross-Tab Analytics!

Can Democratizing BI Use Help My Team?

Why is Business Intelligence Democratization Important for My Business?

Gartner research reveals that, ‘80% of organizations seeking to scale digital business will fail because they do not take a modern approach to data and analytics governance.’

If you are considering democratizing business intelligence gathering and analytics, you are not alone! Businesses today face more competition from local and global markets and every team member must work quickly and accurately in support of goals and objectives if the enterprise is to achieve its goals.

‘When senior executives and managers have reliable information and dependable recommendations and suggestions, they can improve performance and accuracy in forecasting, planning and demand.’

In this article, we discuss a few of the reasons a business should consider democratizing business intelligence and analytics within its team and how this type of initiative can be implemented to help your enterprise succeed.

Should I Democratize Business Intelligence in My Business?

Working Smarter

When you provide BI tools to your business users, you democratize data and begin to build a better understanding of the root cause of problems, the opportunities the business can leverage and the way forward to solving problems and creating business success. Team members can work smarter, with quick, concise access, and insight into data via self-serve solutions that streamline and simplify the typically complex analytical process and allow every team member to perform the analysis and, more importantly, to understand what the results are telling them.

Focusing on Core Responsibilities

When you democratize business intelligence and analytics with augmented analytics tools, IT team members, data scientists and business analysts can focus on strategic goals and on initiatives where data must be 100% accurate. Team members can use BI tools on a daily basis to test theories and gather and analyze information to support activities and tasks, collaborate with others and move forward, so EVERYONE can focus on their own roles and core responsibilities.

Supporting the Greater Good

When senior executives and managers have reliable information and dependable recommendations and suggestions, they can improve performance and accuracy in forecasting, planning and demand. Team leaders, business unit managers and others can realize long-term benefits and count on the fact that all team members are working with the right information, that information and analysis is based on current, integrated data and on measurable results. The organization can shift to a results-based environment where problems are analyzed and resolved and opportunities are leveraged to the greatest extent possible, so the enterprise can create an environment of continuous improvement.

Creating a Common Language

When all team members are using business intelligence to test theories and hypothesize, to solve problems and get to the root of a problem, to identify those all-important ‘nuggets’ of information that make a competitive difference, managers and executives can feel confident that the team is speaking a common language and that every team members knows how to find a problem, how to explain that problem and how to dependable recommendations to solve that problem.

‘Businesses should consider democratizing business intelligence and analytics within teams to help the enterprise succeed.’

Business Intelligence tools can support data democratization and improve your business results. If your business understands the challenges of implementing a business intelligence solution and adequately plans for implementation and user adoption, it can leverage the benefits of these tools and solutions and ensure success. Let us help you achieve your vision and improve productivity and insight across the organization.

Original Post : Should I Democratize Business Intelligence in My Business?

Small & Medium Businesses Need Tally ERP Mobile Analytics!

3 Ways Integrated Tally Mobile Augmented Analytics Can Help Small and Medium Businesses!

As a Tally® ERP user, your business already knows the value of this solution. The Tally solution provides businesses with tools to manage all critical aspects of your business, including accounting, sales and purchase, inventory, manufacturing, taxation, payroll, MIS reporting, etc. As your enterprise grows, and markets become more competitive, it is important to add capabilities that will allow you to be more competitive and help you understand what is happening in your business, what processes, products and activities are helping you to achieve your goals and where you need to adapt.

By integrating augmented analytics into your Tally solution, your team members can leverage analytical tools in an easy-to-use, out-of-the-box environment to produce reports and share data that will offer insight into your business results and strategies.

‘…team members can be creative and innovative in their recommended solutions and, more importantly, can discover the reasons for success or shortfalls.’

By some estimates, the financial analytics market has the potential to reach nearly ten and half million US dollars by 2023. The growth of this market is evidence that businesses are embracing the need for analytics. But when it comes to small and medium sized businesses, the budget for data scientists, analysts and complex analytical solutions is slim to none.

In this article, we discuss three ways that integrated augmented analytics can add to the existing value of the Tally ERP solution and help business users achieve results and gain insight for decision-making and recommendations.

3 Advantages of Tally Mobile Analytics for SMEs

Clear, Concise Reporting Built for Business Users

While Tally ERP provides its own reporting capability, adding flexible analytics reports for sales and purchasing, banking and cash analytics, payables and receivables, inventory management, taxes, cost center and ledger analysis, account statements and drill-down capabilities allows the user to gather data and analyze it across modules and to discover the root cause of an issue, or identify a product, pricing, supplier or other opportunity to leverage in the market. Small and medium sized businesses are often short on resources and users have little time to learn new software or play with report formats to get what they want. By providing a set of built-in reports, business users can be more productive and get the information they need AND they can share that information.

Seamless Access in the Office and On the Road

Nearly every team member in a small or medium sized business has multiple roles and is often on the road or working remotely. Integrated augmented analytics that is accessible in near real-time via mobile or web access allows the user to make the best use of their time and to perform tasks and analyze data from anywhere.

Suitable for all Finance and Accounting Roles

Many best-of-breed solutions are designed to support a specific need within the organization. Accounting systems are designed for accounting professionals, inventory systems are typically designed as part of an ERP system and support the needs of inventory managers. Tally ERP has modules that are designed for sales, accounting, finance, inventory and other roles. By integrating augmented analytics within this environment, every professional (no matter their role) can use the solution in a way that is best suited for their needs. An additional advantage is the ability to perform simple queries across modules and data so a sales manager might spot a problem with an ad campaign scheduled to promote a product for which there is little inventory, or a purchasing manager might create a report to reveal where bulk orders for multiple business units might result in lower pricing. In truth, while every professional has a specific role, many responsibilities and tasks cross over from one department to another and, with the ability to perform searches and analytics that incorporate data from across the enterprise, team members can be creative and innovative in their recommended solutions and, more importantly, can discover the reasons for success or shortfalls.

‘By integrating augmented analytics into your Tally solution, your team members can leverage analytical tools in an easy-to-use, out-of-the-box environment.’

Find out how the addition of SmartenApps For Tally will support your accounting-related analytical initiative and bring your team and your business to the next level. Users can Download And Register for SmartenApps for Tally and use Tally data to analyze, explore and clarify.

3 Ways Integrated Tally Mobile Augmented Analytics Can Help Small and Medium Businesses

Original Post : 3 Advantages of Tally Mobile Analytics for SMEs!

Enjoy Seamless Integrated Analytics for Tally ERP!

How Can Tally ERP Users Leverage Their Favorite App to Perform Analytics?

Gartner predicted that, ‘a scarcity of data scientists will no longer hinder the adoption of data science and machine learning in organizations.’ If businesses wish to fulfil this prediction, managers must choose self-serve tools that will allow for analytics and fact-based decision making without hiring a team of professional data scientists AND they must leverage the tools already in place to enable user adoption of analytics.

But how?

‘To enable analytics in the Tally ERP environment, the enterprise must carefully consider the ease-of-use of the solution, whether it requires training, how accessible the solution is and whether the business user can accomplish tasks easily.’

In this article, we discuss the use of Tally ERP and how your business users’ favorite business application can be used to engender analytics and more accurate decisions.

Enable User Adoption with Self-Serve BI and Cross-Tab Analytics
  • With integrated analytics, business users can leverage Tally ERP to gain access to and better understand results, and analyze and report data, using integrated analytics to explore, and clarify via the web or mobile applications.
  • Users have near real-time access to recent transactions and can work inside or outside the office to access Tally data and analyze, report and collaborate.
  • The organization can implement and start using integrated analytics quickly so there is no wait time or extensive training required. The enterprise can encourage data democratization, allow users to leverage domain and industry knowledge and the data within Tally ERP to perform analysis.
  • Out-of-the-box analytics and intuitive dashboards and reports allow for analysis of sales, purchasing, banking and cash, payables, receivables, inventory, taxes, cost centers, account statements and other reports, all with drill-down capability.

‘Discover how your business users’ favorite business application can be used to engender analytics and more accurate decisions.’

With easy-to-use tools and the ability to leverage the familiar Tally ERP solution, users do not have to choose between day-to-day tasks and analytics. They can do both, in the office or in a mobile environment. Because team members often resist change and new responsibilities, the enterprise must carefully consider the ease-of-use of the solution, whether it requires training, how accessible the solution is and whether the business user can accomplish tasks easily without having to deal with data in a silo environment. Integrated access and easy tools are key!

Find out how the addition of SmartenApps for Tally will support analytical initiatives and provide benefits to your users and your enterprise. Users can Download And Register for SmartenApps for Tally and use Tally data to analyze, explore and clarify and to provide insight to clients, colleagues, management and team members.

Original Post : How Can Tally ERP Users Leverage Their Favorite App to Perform Analytics?

Embrace Trends with Tally ERP Integrated Analytics!

3 Reasons to Integrate Augmented Analytics for Tally ERP to Leverage Analytical Trends!

Rutgers Business School and the American Institute of CPAs (AICPA) recently announced the formation of the Rutgers AICPA Data Analytics Research Initiative for further integration of data analytics into the audit process and advancement in the public accounting profession. As research firms, technology analysts and industry leaders embrace the concept of analytics in accounting and finance, it is prudent to consider the impact on enterprise solutions and software.

‘If a business wishes to embrace the analytical trends for this industry, it must provide easy-to-use tools that are cost-effective and allow for swift integration, implementation and user adoption.’

If organizations are to increase the return on investment (ROI) for these existing solutions and, at the same time, embrace the analytical trend, these businesses must find a way to provide the right tools to business professionals – and those tools had better not be designed for IT or data scientists or there will be no hope of getting users to adopt new techniques and leverage analytics in their day-to-day environment.

In this article, we discuss three advantages of integrating analytics with Tally ERP to stay abreast of industry trends.

Stay Abreast of Trends with Tally ERP Integrated Analytics

Designed for Business Users of Tally ERP

The accounting, inventory, purchasing, sales and other finance-related modules in the Tally solution are popular with users and are used on a daily basis for data entry, simple reporting and completion of workflow tasks. Adding augmented analytics to the functionality and features provides support for new business goals so management, IT and analysts can enable business users with analytics and add value to clients and to the organization without requiring business users to take data science training or to have advanced technology skills. Business users can leverage their domain and professional expertise to find and analyze data and test theories, solve problems and gain insight to be shared with the organization and clients. If a business intends to follow the trends of financial and accounting analytics, it must ensure that any new tools are designed for the average business users and will allow them to follow existing workflow and business processes.

Integrated with Tally Functionality for Easy Access and Intuitive Use

Any new augmented analytics solution must be easily integrated with Tally ERP in order to be cost-effective and to avoid delays in implementation and user adoption. Mobile access is fundamental to success, as many team members today are on the road, working remotely or accessing data from client locations or other office locations. Providing integrated functionality allows business users to work within the Tally ERP solution, using familiar tools and views while, at the same time, leveraging new, sophisticated analytical functionality that will improve their performance and value to the organization.

Flexible, Pre-Built Reporting for Clear Results

Tally ERP does provide reporting capability but, if the organization is going to advance to true analytics and ask its business professionals to get on board, it must provide simple, easy-to-use reporting capability that will offer powerful results. Reports should include overview reports with top and bottom analysis, contribution analysis, KPI analysis, and sales and purchasing reports for monthly, quarterly and annual trends, top customers, detailed sales registers, etc., as well as bank and cash reports so users can compare historical and current results. Payable and receivable reports should allow for reporting by creditor, debtor, product, service and overdue collections trends. Inventory reporting and analysis should encompass overstock, understock, suppliers, products, shipping and distribution. Other reports should include taxes with estimated obligations, cost center analysis and balances by account and group, ledger entries and balances with drill-down to voucher level, account statements for statutory review and submission, etc.

‘If organizations wish to embrace analytical trends, they must find a way to provide the right tools…and those tools had better not be designed for IT or data scientists or there will be no hope of getting users to adopt new techniques.’

If a business wishes to stay ahead of the competition and embrace the analytical trends for this industry, it must provide easy-to-use tools that are cost-effective and allow for swift integration, implementation and user adoption.

Find out how the addition of SmartenApps For Tally will support analytical initiatives and provide benefits to your users and your enterprise. Users can Download And Register for SmartenApps for Tally and use Tally data to analyze, explore and clarify and to provide insight to clients, colleagues, management and team members.

Original Post : Stay Abreast of Trends with Tally ERP Integrated Analytics!

Improve Financial Accuracy with Tally ERP Analytics!

What Insights Can My Business Gain from Integrated Tally Mobile Analytics?

Tally® ERP is a popular finance and accounting solution used by many team members in many businesses. It provides modules to support inventory management, purchasing, sales professionals, accountants, finance managers and other expense and revenue related functions responsible for taxes, statutory reporting etc.

3 Ways Cross-Tab BI Can Improve Reporting!

By some estimates, a business will experience a three-month lag between the time a report is produced and the point at which the enterprise sees improvement or results from the changes the report recommends or predicts. If the reporting is unclear or unconvincing, the recommendations may never be implemented and the report will sit in a file on someone’s computer.

Three Benefits of Integrating Analytics with Tally ERP!

There are many finance-related roles within a business. Whether you are an accountant or a finance manager or controller, or you manage inventory, purchasing, sales or other critical areas of the business, it is likely that you are responsible for a budget and for mitigating expenses and improving revenue. Tally® ERP users understand the software solution and use it daily to enter data and to produce standard reports.

Mobile Augmented Analytics & Tally ERP: A Winning Combination!

When Considering Tally ERP Mobile Access, Add Augmented Analytics to Complete the Picture!

No matter the task or job, every team member needs the right tools to be successful. Accountants, finance professionals, purchasing managers, inventory professionals and other team members responsible for expenses and revenue need the right tools to do their jobs and, in this day of remote work and dispersed teams, that need is greater than ever. The answer to that need is, of course, founded on technology.

Accounting and Finance Pros Can Use Tally ERP Analytics!

Leverage Integrated Analytics Reporting in Tally ERP!

The Rochester Institute of Technology (RIT) states that, ‘Accounting analytics can help an organization answer financial questions by looking at all the data gathered by a company (e.g., transactional data, financial data, investment analysis, etc.) and analyzing this information to gain significant insights, predict future outcomes, or even ascertain risk.’