Case Study : Augmented Analytics Solution for India State Government Citizen Centric Schemes

Augmented Analytics Solution for India State Government Citizen Centric Schemes

The Client is a state government with a population of approximately 30 million citizens, and an annual budget of $5 billion USD. This government agency focuses on implementing IT and e-governance initiatives to enhance citizen services and governance efficiency. By leveraging advanced technology, the agency aims to improve the quality of life for citizens and to streamline administrative processes across and throughout departments.

Understanding BI Tools in Today’s Market

How Do We Define Business Intelligence Today?

Business Intelligence (BI) is the lifeblood of an organization. Without business intelligence, the enterprise does not have an objective understanding of what works, what does not work, and how, when and where to make changes to adapt to the market, its customers and its competition.

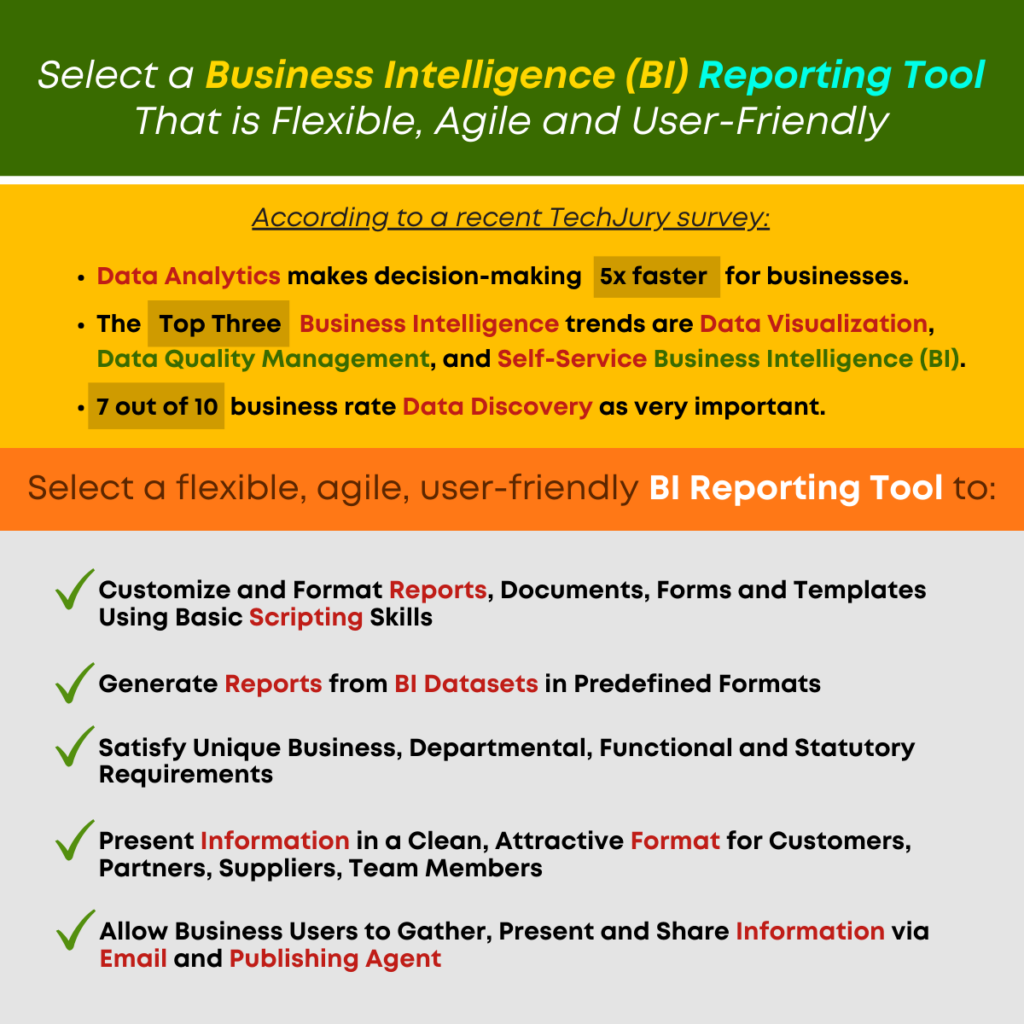
You may be interested to know that TechJury reports seven out of ten businesses rate data discovery as very important, and that the top three business intelligence trends are data visualization, data quality management and self-service business intelligence.

As the Business Intelligence solution market evolves, it may be difficult for an organization to know when to invest in these tools, and which tools are best for enterprise and user needs.

Self-Serve Cross-Tab BI Tools Reveal Issues and Possibilities!

Self-Serve BI Tools with Cross-Tab Reporting Improve Clarity and Results!

If you are considering a Business Intelligence solution or BI tool, or if you wish to upgrade your business intelligence and reporting tools, look for a solution that has self-serve cross tabulation, or cross-tab reporting. Cross-Tab reporting reveals the relationship between two factors or targets. This analytical tool can be used for side-by-side comparisons and to compare results for one or more data points, variables, or targets.

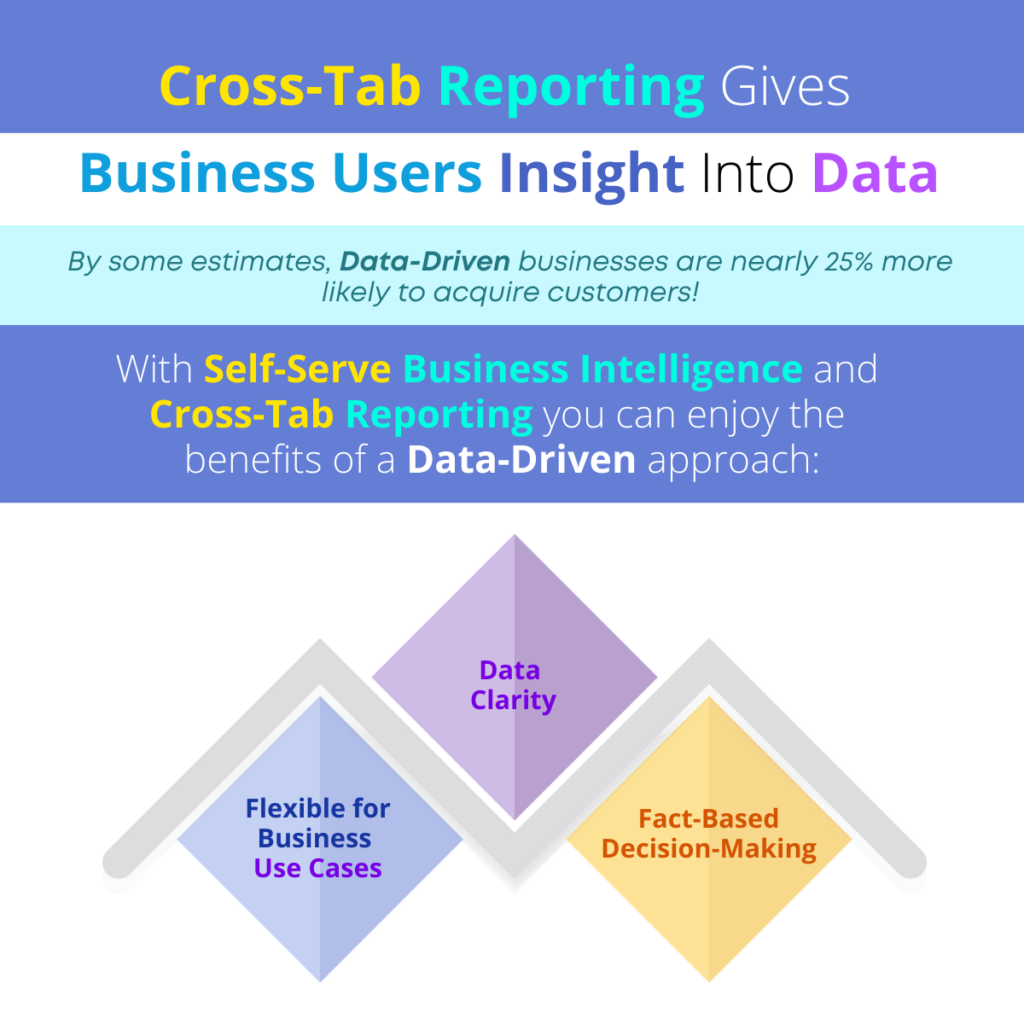
Did you know that, by some estimates, data-driven businesses are nearly 25% more likely to acquire customers? If you can give your team easy-to-use BI tools with self-serve cross-tab reporting, you can put the power of market and customer knowledge in their hands!

‘Business Intelligence solutions with self-serve cross-tab reporting can provide an intuitive, clear method of data analysis for your business users by revealing relationships in a way that makes the results clear and helps the organization to make the best decisions.’

In this article, we discuss the value of self-serve BI tools with Cross-Tab capabilities and the benefits of this type of focus and insight.

Cross-Tab Reporting Gives Business Users Insight Into Data

Benefits of Self-Serve Cross Tabulation Reporting

Flexible for Business Use Cases

Cross-tab reporting allows for intuitive use by business users with average technical skills, and can be beneficial for all types of business functions and industries. In an educational setting, a university or school might use cross-tab reporting to analyze teacher or course evaluations, looking at the relationship between student satisfaction and the subject, the class time, class location and other factors. Businesses can analyze team and employee satisfaction and attrition by looking at job location, benefits, the results of exit interviews, available training, and support, etc. Cross-tab reporting is frequently used in market research to analyze the various factors that relate to product or service satisfaction, including product features and options, where and how the product is sold, the sales and marketing approach, etc. A retail store owner might use cross-tab data analysis to determine customer satisfaction by looking at demographics, the gender of the person buying the product, the price of the product in a particular region, etc.

Data Clarity

There are many ways to slice and dice data and many ways in which crucial information can hide inside that data. The self-serve cross-tab reporting approach allows business users to examine relationships among data points and factors, with more clarity and accuracy. This type of analysis provides more clarity and reveals results, interdependent relationships and factors that might otherwise be missed. Users can avoid confusion when working with data and analyze large datasets to reveal frequencies and percentages. With this information, the business can understand the ‘what if’ of the various factors and see how results would change if one factor or relationship is changed.

Fact-Based Decision-Making

Self-serve cross-tab reporting simplifies analytics and allows business users to spot trends and patterns and collaborate with other team members to adapt tasks and activities to resolve issues and/or capitalize on opportunities. Using cross tabulation reporting to understand the connection and relationship between two or more factors allows the business to make a decision, with confidence. Rather than guessing the reason for declining results, increased employee attrition or other problems, the enterprise can clearly see what factors (and the relationships among factors) are the cause of a problem and how to change those factors to get better results.

‘If you can give your team easy-to-use BI tools with self-serve cross-tab reporting, you can put the power of market and customer knowledge in their hands!’

Business Intelligence solutions with self-serve cross-tab reporting can provide an intuitive, clear method of data analysis for your business users by revealing relationships in a way that makes the results clear and helps the organization to make the best decisions. By giving your team members these tools, you can leverage domain and industry knowledge and combine data analytics in a day-to-day environment without the need for assistance from data scientists or the IT staff. Self-Serve Cross-Tab reporting produces clear results that are easy to understand and can be used in staff meetings and presentations to support recommendations and help the business become more agile.

Look for seamless Business Intelligence Reporting And Flexible Tools that include self-serve Cross-Tab reporting. Provide business intelligence that your IT team can easily implement and support, and a solution that business users will want to adopt. Choose  flexible, agile business intelligence solutions that can be used at all levels to collaborate, share data, and report and communicate with clarity. Self-Serve BI Tools can provide your business with the foundation to achieve your data democratization and user adoption goals.

Original Post : Cross-Tab Reporting Gives Business Users Insight Into Data!

Case Study : Smarten Analytics Case Study – Implementation for Largest Global Air Cooler Company in India

Smarten Augmented Analytics Case Study- Implementation for Largest Global Air Cooler Company in India

The Client is the largest global manufacturer of Air Coolers. The Client is an India-based Multi-National Company with a presence in over sixty (60) countries. As the market leader, this enterprise enjoys a prime position in the residential, industrial and commercial market segments and its brand is considered synonymous with cooling products in the global market. The Client is a market disrupter in what is a diverse and poorly organized sector and it has set the market benchmark with 201 trademarks, 64 registered designs, 15 copyrights and 48 patents, thereby setting the gold standard for air cooling in the global market.

Why Not Embrace the Advantages of Self-Serve BI Tools?

Don’t Be Daunted by the Challenges of BI Tools. Self-Serve BI is the Answer!

Gartner research reveals that, ‘90% of corporate strategies will explicitly mention information as a critical enterprise asset and analytics as an essential competency.’ As business professionals, we all know that information is power and today, your business users are expected to know more and to keep pace with industry, market and customer changes that will negatively impact the business or have provide potential opportunities. But how do your team members achieve these goals when they are busier than ever, and the changes are coming more rapidly than ever!

‘Simple, self-serve BI tools can provide your business with the foundation to achieve your goals with features and tools like Social BI, Mobile BI, Embedded BI, etc.’

In this article, we will discuss the topic of modern business intelligence tools and solutions and the advantages of providing self-serve tools to your users for day-to-day analysis and intelligence gathering.

Let’s Discuss: Benefits and Challenges of Self-Serve BI

First, let’s look at some of the challenges you will need to consider when implementing self-serve BI tools:

Challenges of Self-Serve BI

  • Technology Access and Infrastructure Readiness – Your IT, finance and management teams will need a comprehensive understanding of your current technology and infrastructure, the data hubs, data warehouses and software solutions (legacy, best-of-breed, ERP, etc.) that will provide the foundational data for your users. You will need a plan and a roadmap to integrate these into your business intelligence strategy. A modern, seamless BI solution can provide a simple solution for what might otherwise be a challenging situation. If you can easily integrate your data sources and make them available for data gathering and analytics, your users can leverage the data to report, share and collaborate.
  • Team Member Adoption and Understanding – Your team will also need an understanding of the average technology skills of your business users and their willingness to adopt new tools and solutions. If your team members perceive that your BI tools are difficult to use, or if they are not educated on the need for and the benefits of self-serve business intelligence, they are unlikely to adopt the new tools. If, on the other hand, they see the value to their role and how it can make them more productive and streamline their work process; if they see that the solution is easy and intuitive to use, your business is less likely to face the challenges of team reluctance.

There are many other challenges and considerations that should inform your BI tools strategy, but these two are perhaps the most important.

Now, let’s consider some of the many benefits of self-serve business intelligence and how it can support your goals and simplify the lives of your business users:

Benefits of Self-Serve BI

  • Social BI – Social BI allows users to champion the use of business intelligence. Power users and those who are curious by nature will create reports, share and collaborate, using easy-to-use tools and thereby encourage others to use the tools and to repurpose report formats etc. to achieve their own goals. Social BI allows business users to share, ‘like’ and perform tasks in a way that is similar to social networking and is therefore popular among business users.
  • Mobile BI – Today’s team members often work remotely, or spend a lot of time on the road. By providing self-serve business intelligence that is intuitive to use and accessible on Android and iOS devices, the business can ensure that users will have seamless access and can accomplish tasks, search for information, share and collaborate, without missing a beat!
  • Data Democratization and Data Literacy – If you want your team members to grow and add more value, you want to encourage data literacy and ensure data democratization. Move away from restricted data access and sole ownership of analytics by data scientists, IT and business analysts. Provide easy-to-use tools that allow for simple search analytics in a Google-type environment and will make it easier for reluctant business users to embrace your new BI solution and develop new data analytics skills they can use for fact-based decisions.
  • User Adoption – There is nothing more frustrating than spending the time and money to implement a new solution, only to find that your users are resistant to using that solution. With true self-serve BI tools and intuitive data visualization, reporting, analytics and access, users will want to adopt the tools and share their discoveries with other team members.
  • Embedded BI – If you want to leverage existing technology, improve your Return on Investment (ROI) and Total Cost of Ownership (TCO) for your current solutions and infrastructure, consider that self-serve BI tools can be embedded into existing solutions. With embedded BI with Integration APIs, users can leverage familiar, favorite software solutions in a single sign-on environment, and find information within those solutions without having to learn complicated new techniques or fighting with data silos and transferring data from one place to another.

There are many other advantages to Self-Serve Business Intelligence. This short list should give you some ideas of how you can leverage these tools in your own business landscape.

‘As business professionals, we all know that information is power and today, your business users are expected to know more and to keep pace with industry, market and customer changes that will negatively impact the business or have provide potential opportunities.’

Business Intelligence solutions should include tools and techniques that make it easier to achieve data literacy and provide data analytics access to all business users. Simple, self-serve BI tools can provide your business with the foundation to achieve your goals with features and tools like Social BI, Mobile BI, Embedded BI, etc.  Let us help you achieve your vision and improve productivity and insight across the organization.

Original Post : Let’s Discuss: Benefits and Challenges of Self-Serve BI!

Users Love Self-Serve BI and Cross-Tab Analytics!

Ensure Business Users Will Adopt BI Tools with Self-Serve BI and Cross-Tab Analytics!

Gartner has predicted that, ‘90% of corporate strategies will explicitly mention information as a critical enterprise asset and analytics as an essential competency.’ Establishing the strategy is one thing, but getting business users to adopt an analytics and information-based business workflow is quite another.

‘Modern business intelligence tools that are designed with self-serve features makes it easy enough for every user (no matter their technical skill) to leverage analytics to report, share and collaborate.’

When it comes to teams, there are two things that are always true: 1) they learn a process and workflow and rarely want to change that familiar process and 2) they are always suspicious of ‘new’ initiatives and nearly always believe that these new initiatives will result in more work for them. There is a reason your team resists new processes and initiatives and that reason is simple. Usually, their fears are warranted!

So, if you want to engender support for new analytics initiatives and engage a business community in fact-based, action-oriented initiatives, you need to plan this new initiative with your users in mind.

In this article, we focus on two of the primary components of a new business user analytics initiative.

Enable User Adoption with Self-Serve BI and Cross-Tab Analytics

Self-Serve BI Tools

Modern business intelligence tools that are designed with self-serve features like smart data visualization, self-serve data preparation and assisted predictive modeling make it easy enough for every user (no matter their technical skill) to leverage analytics to report, share and collaborate. By adding value to the user’s everyday tasks and reducing the rework and issues they will confront, you can encourage your users to adopt analytics initiatives.

  • Any promotion of analytics strategy must clearly illustrate business use cases and benefits of these tools.
  • Support a more productive, streamlined environment that will allow them to do more with less and get the job done quickly.
  • Ensure that business users can collaborate and share and grow their own expertise and visibility.
  • Provide measurable results and information to make recommendations and support those recommendations.

Cross-Tab Analytics Capabilities

Those self-serve tools should include reporting and graphical tools that are clear and concise. Business users don’t want tools that produce complex reports filled with columns and mind-numbing numbers that do not help them reach a decision or illustrate an issue. Cross-tab analytics have been around for some time but the new, improved versions of this capability provides real insight into data in a way that is clear for every user. Sophisticated functionality is underpinned with easy-to-use tools so users can analyze the relationship between or among two or more variables and summarize data in rows and columns making it easy to understand the relationships and intersection of the various types of data. Understanding relationships in data is crucial to identifying the root cause of a problem or to targeting an issue or identifying a business opportunity. Your team members can work with multi-dimensional data and perform ad-hoc queries to gain a clear view of performance, dive into your data, and find and understand the data they need quickly and intuitively. Cross-tab analysis simplifies complex data operations, summary operations, time series functions, filters and custom column expressions and enables business users with simple tools they can really use.

‘If you want to engender support for new analytics initiatives and engage a business community in fact-based, action-oriented initiatives, you need to plan this new initiative with your users in mind.’

Business Intelligence tools can improve your business results. If your business understands the challenges of implementing a business intelligence solution and adequately plans for implementation and user adoption, it can leverage the benefits of these tools and solutions and ensure success. Let us help you achieve your vision and improve productivity and insight across the organization.

Original Post : Enable User Adoption with Self-Serve BI and Cross-Tab Analytics!

Can Democratizing BI Use Help My Team?

Why is Business Intelligence Democratization Important for My Business?

Gartner research reveals that, ‘80% of organizations seeking to scale digital business will fail because they do not take a modern approach to data and analytics governance.’

If you are considering democratizing business intelligence gathering and analytics, you are not alone! Businesses today face more competition from local and global markets and every team member must work quickly and accurately in support of goals and objectives if the enterprise is to achieve its goals.

‘When senior executives and managers have reliable information and dependable recommendations and suggestions, they can improve performance and accuracy in forecasting, planning and demand.’

In this article, we discuss a few of the reasons a business should consider democratizing business intelligence and analytics within its team and how this type of initiative can be implemented to help your enterprise succeed.

Should I Democratize Business Intelligence in My Business?

Working Smarter

When you provide BI tools to your business users, you democratize data and begin to build a better understanding of the root cause of problems, the opportunities the business can leverage and the way forward to solving problems and creating business success. Team members can work smarter, with quick, concise access, and insight into data via self-serve solutions that streamline and simplify the typically complex analytical process and allow every team member to perform the analysis and, more importantly, to understand what the results are telling them.

Focusing on Core Responsibilities

When you democratize business intelligence and analytics with augmented analytics tools, IT team members, data scientists and business analysts can focus on strategic goals and on initiatives where data must be 100% accurate. Team members can use BI tools on a daily basis to test theories and gather and analyze information to support activities and tasks, collaborate with others and move forward, so EVERYONE can focus on their own roles and core responsibilities.

Supporting the Greater Good

When senior executives and managers have reliable information and dependable recommendations and suggestions, they can improve performance and accuracy in forecasting, planning and demand. Team leaders, business unit managers and others can realize long-term benefits and count on the fact that all team members are working with the right information, that information and analysis is based on current, integrated data and on measurable results. The organization can shift to a results-based environment where problems are analyzed and resolved and opportunities are leveraged to the greatest extent possible, so the enterprise can create an environment of continuous improvement.

Creating a Common Language

When all team members are using business intelligence to test theories and hypothesize, to solve problems and get to the root of a problem, to identify those all-important ‘nuggets’ of information that make a competitive difference, managers and executives can feel confident that the team is speaking a common language and that every team members knows how to find a problem, how to explain that problem and how to dependable recommendations to solve that problem.

‘Businesses should consider democratizing business intelligence and analytics within teams to help the enterprise succeed.’

Business Intelligence tools can support data democratization and improve your business results. If your business understands the challenges of implementing a business intelligence solution and adequately plans for implementation and user adoption, it can leverage the benefits of these tools and solutions and ensure success. Let us help you achieve your vision and improve productivity and insight across the organization.

Original Post : Should I Democratize Business Intelligence in My Business?

BI Tools Provide Benefits and Challenges!

Understand the Benefits and the Challenges of a Business Intelligence Strategy!

If you follow industry and business publications, you know that analytics are taking the lead in business strategy. Gartner states that, ‘90% of corporate strategies will explicitly mention information as a critical enterprise asset and analytics as an essential competency.’ If your enterprise is implementing a business intelligence and analytics strategy, it is important to plan carefully and to understand the real benefits as well as the challenges of choosing the right BI tools and deploying these tools to users in a way that will ensure optimal user adoption and leverage of analytics to achieve the results you need.

‘Your business should carefully assess requirements and plan for expected user adoption by selecting a BI tool that will offer the features, ease-of-use and functionality your team members need.’

In this article, we provide examples of the various benefits of BI tools for specific business functions and some of the technology and user challenges you will face as you consider your options and plan for implementation.

Address the Challenges and Achieve the Benefits of BI Tools

No matter the business function, there are benefits to implementing a business intelligence strategy that will deploy these tools to your team members. Here are some examples:

Benefits

Finance – Your organization will be more efficient and profitable, with Ready-to-Use Dashboards, Analysis, and KPIs designed especially for the Finance domain. This business intelligence solution includes interactive Dashboards that allow users to perform intuitive, easy analysis of key metrics including Profitability, Accounts Receivable, Accounts Payables, Cash Flow Analysis, Past Due Invoices, Balance Sheets, Income Statements and more!

Inventory – Inventory business function allows users to accurately plan and optimize inventory. Interactive Dashboards track item movement, compare sales to closing stock, and monitor warehouse stock and value, and answer critical questions regarding stock turnover ratio, seasonal buying, back-order assessment and safety stock to prevent lost sales. Users can analyze inventory levels to effectively manage stock based on the buying behavior of customers.

Purchasing and Procurement – Allows users to view and analyze spending details, analyze procurement data, drill through data to analyze issues, measure performance, identify savings opportunities, and track supplier performance. Identify reliable trading partners, analyze supplier cost, perform purchase rate comparisons, reveal trends, identify top/bottom vendors, and achieve timely insight into spending patterns and trends across all departments.

Production – Quantify and visualize data at the operational level to make fact-based decisions. Analyze Output, Reduce Labor Costs, Maintain Inventory Levels, Optimize Equipment Performance, Monitor Rejection Ratios and Downtime, and take action before problems arise to mitigate risk, and capitalize on opportunities. Publish automated reports to monitor and manage plant performance and provide management with quality metrics and relevant data.

These are just a few examples of how business intelligence can be used within a business function, department or business unit to benefit business users and to help the organization make fact-based decisions, spot trends and patterns and opportunities, and identify the root cause of problems.

If you want to take advantage of all of these benefits and ensure success of your business intelligence initiative, your business should carefully assess requirements and plan for expected user adoption by selecting a BI tool that will offer the features, ease-of-use and functionality your team members need.

Technology and User Challenges

Social BI

Your team members are also consumers and outside of the office they are used to a collaborate and social experience. By engaging in Social BI, your team can champion data sharing, collaborate on creative ways to analyze data and make quick work of data analytics, with tools that allow the user to ‘like’, ‘share’ and leverage other social tools and networking techniques.

Mobile BI

Not every BI tool provides real mobile business intelligence to accommodate every type of device, screen size and resolution. Choose a solution that has a Responsive and Adaptive UI engine, so you can roll out BI tools on any Desktop, Tablet or Smartphone without any device specific development. ‘Design once, Use anywhere’ concept in true sense.

Personalized Dashboards

Business users will not adopt a solution that limits them to predefined dashboards. Each user has a need to see and use data in a different way. Be sure to select a solution that allows your users to work in a way that is meaningful to them.

Interactive, NOT Restrictive

Choose a solution that will allow users to leverage deep dive analytics. There is no way an organization can anticipate every question or type of analytics a business user will need to incorporate into decision-making. Provide truly interactive tools that will assure user adoption and make your organization more agile.

Ease-of-Use

Advanced Data Discovery allows business users to perform early prototyping and to test hypothesis without the skills of a data scientist. Advanced Data Discovery ensures data democratization with Self-Serve Data Preparation, Smart Data Visualization and Plug n’ Play Predictive analysis that can drastically reduce the time and cost of analysis and experimentation.

‘No matter the business function, there are benefits to implementing a business intelligence strategy that will deploy these tools to your team members.’

Ready-To-Use Business Intelligence tools can support data democratization and improve your business results. If your business understands the challenges of implementing a business intelligence solution and adequately plans for implementation and user adoption, it can leverage the benefits of these tools and solutions and ensure success. Let us help you achieve your vision and improve productivity and insight across the organization.

Original Post : Address the Challenges and Achieve the Benefits of BI Tools!

Prepare for Success with the Right BI Tools!

4 Things to Know to Prepare for BI Tools and Data Democratization!

The days of data silos and exclusive data access are over. Data Scientists and business analysts are still an important component of the business and IT teams are still crucial to the success and stability of the organization BUT if you are thinking that these roles are still responsible for day-to-day analytics and delivering every bit of data analysis to the enterprise, your business strategy needs an upgrade!

Leverage Key Performance Indicators to Achieve Results!

Key Performance Indicators and Performance Management are Crucial to Business Agility!

When a business takes on the task of going from an opinion-based, guessing game environment to a metrics-based, fact-based environment, it must decide WHAT to measure. Metrics are fine, but deciding what is important to measure is crucial. You can measure the wrong things and end up knowing nothing about what is happening in your enterprise, and which tasks and activities are contributing to your bottom line, as opposed to the tasks that are non-productive and business processes that should be modified.