
The Client is a state government with a population of approximately 30 million citizens, and an annual budget of $5 billion USD. This government agency focuses on implementing IT and e-governance initiatives to enhance citizen services and governance efficiency. By leveraging advanced technology, the agency aims to improve the quality of life for citizens and to streamline administrative processes across and throughout departments.
Tag: KPI Tools
The Client is an India-based construction and infrastructure development company, committed to delivering quality infrastructure for private, public, and government projects. With over fifty (50) years of accumulated knowledge and experience, the organization applies its extensive resources to ensure superior infrastructure solutions.
How Do We Define Business Intelligence Today?
Business Intelligence (BI) is the lifeblood of an organization. Without business intelligence, the enterprise does not have an objective understanding of what works, what does not work, and how, when and where to make changes to adapt to the market, its customers and its competition.
You may be interested to know that TechJury reports seven out of ten businesses rate data discovery as very important, and that the top three business intelligence trends are data visualization, data quality management and self-service business intelligence.
As the Business Intelligence solution market evolves, it may be difficult for an organization to know when to invest in these tools, and which tools are best for enterprise and user needs.
BI Tools with Self-Serve Multidimensional KPIs Enable Agility and Accuracy!
Gartner research reveals that, ‘data literacy will become an explicit and necessary driver of business value, demonstrated by its formal inclusion in over 80% of data and analytics strategies and change management programs.’ When businesses adopt and embrace business intelligence and augmented analytics, the expectation is that the enterprise will benefit by improving data literacy as well as productivity.
But if your business wants to make the most out of BI tools and augmented analytics, it is important to choose the right solution; one that is easy to use and will provide clear results – results business users can leverage to make decisions and to plan accurately. To understand the results and whether policies, processes and tasks are effective, your organization must establish metrics, and those metrics must also be clear.
‘Key Performance Indicators (KPIs) are crucial to this feature set, as they provide critical metrics that enable the business to discover and manage results objectively and to adapt and change quickly and effectively.’
A solution that provides easy-to-use, multidimensional key performance indicators (KPIs) will allow your team to establish metrics that are unique to your needs and to your industry and market and help the enterprise understand how the business measures up in the competitive market, how well the products and services are faring with customers and whether workflow and business processes are having the desired effect.

Benefits of Self-Serve, Multidimensional Key Performance Indicators (KPIs)
- When the organization gives business users the tools to establish and manage KPIs, it can become more productive. There is no waiting for the IT team or a data scientist to produce important reports, so the team can be agile and flexible.
- Interactive KPIs provide tools to gather, analyze and measure with breakdown and dynamic frequency and slice and dice so users can focus on critical metrics and gain true insight into results. Users can leverage a powerful expression engine to set polarity, frequency and threshold levels in a browser-based interface and go beyond static monitoring to change frequencies, and dimension breakdowns and gain an understanding of performance and issues.
- Users can establish and monitor KPIs at the individual, team, department, division, and company level and KPIs are integrated with other features to further analyze trends. Multidimensional KPIs gives business users the opportunity to monitor and manage results against goals and objectives and change processes, tasks, and activities as and when change is required.
‘When your business chooses a BI tool, it is important to choose the right solution; one that is easy to use and will provide clear results – results business users can leverage to make decisions and to plan accurately.’
If your business wishes to improve data literacy and productivity by implementing or upgrading a Business Intelligence or Augmented Analytics solution, it is imperative that you review the available modules, tools and features to ensure that the solution provides easy-to-use, sophisticated functionality that is suitable for your business users. Key Performance Indicators (KPIs) are crucial to this feature set, as they provide critical metrics that enable the business to discover and manage results objectively and to adapt and change quickly and effectively.
Choose a Business Intelligence Reporting Solution that include Multi-Dimensional Key Performance Indicators (KPIs). Provide business intelligence that your IT team can easily implement and support, and a solution that business users will want to adopt. Choose flexible, agile business intelligence solutions that can be used at all levels to collaborate, share data, and report and communicate with clarity. Self-Serve BI Tools can provide your business with the foundation to achieve your data democratization and user adoption goals.
Original Post : Multidimensional KPIs Provide Easy-to-Use, Objective Metrics!
Self-Serve BI Tools with Cross-Tab Reporting Improve Clarity and Results!
If you are considering a Business Intelligence solution or BI tool, or if you wish to upgrade your business intelligence and reporting tools, look for a solution that has self-serve cross tabulation, or cross-tab reporting. Cross-Tab reporting reveals the relationship between two factors or targets. This analytical tool can be used for side-by-side comparisons and to compare results for one or more data points, variables, or targets.
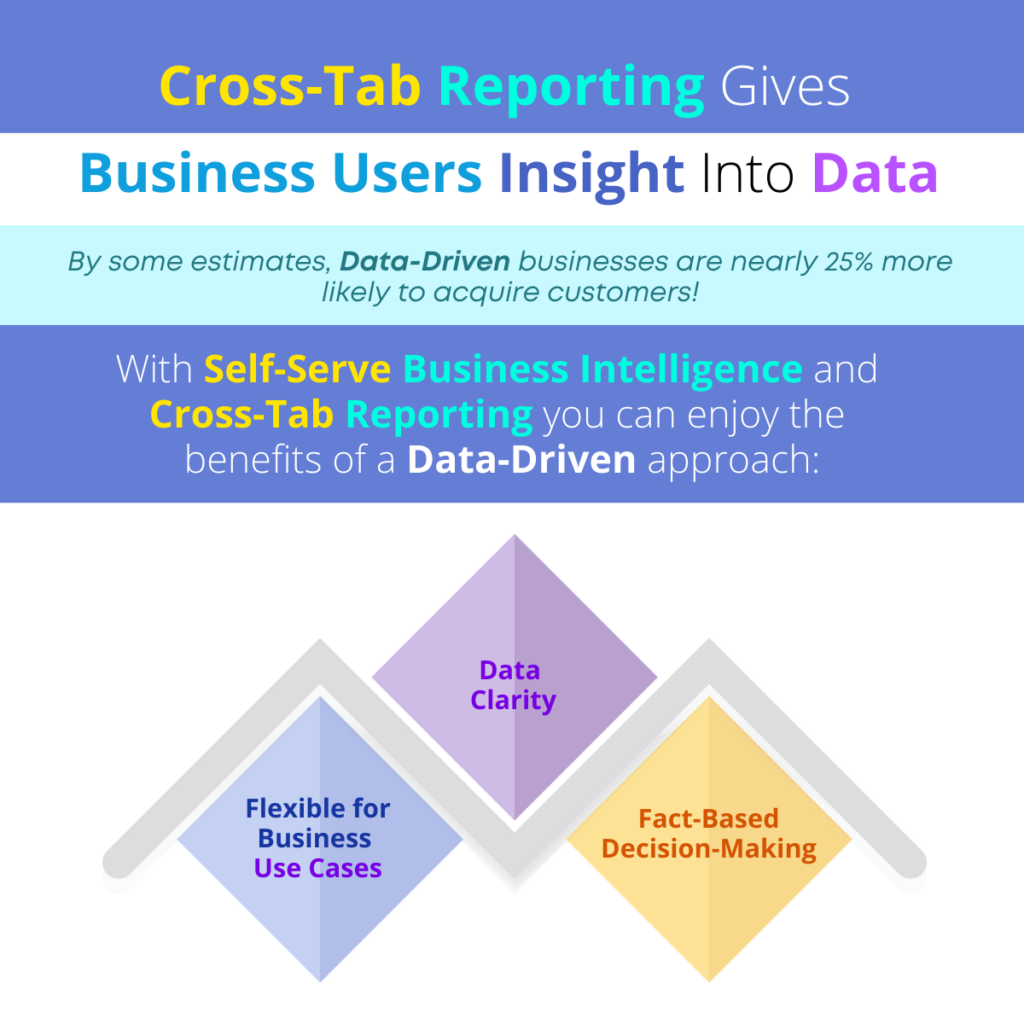
Did you know that, by some estimates, data-driven businesses are nearly 25% more likely to acquire customers? If you can give your team easy-to-use BI tools with self-serve cross-tab reporting, you can put the power of market and customer knowledge in their hands!
‘Business Intelligence solutions with self-serve cross-tab reporting can provide an intuitive, clear method of data analysis for your business users by revealing relationships in a way that makes the results clear and helps the organization to make the best decisions.’
In this article, we discuss the value of self-serve BI tools with Cross-Tab capabilities and the benefits of this type of focus and insight.
Benefits of Self-Serve Cross Tabulation Reporting
Flexible for Business Use Cases
Cross-tab reporting allows for intuitive use by business users with average technical skills, and can be beneficial for all types of business functions and industries. In an educational setting, a university or school might use cross-tab reporting to analyze teacher or course evaluations, looking at the relationship between student satisfaction and the subject, the class time, class location and other factors. Businesses can analyze team and employee satisfaction and attrition by looking at job location, benefits, the results of exit interviews, available training, and support, etc. Cross-tab reporting is frequently used in market research to analyze the various factors that relate to product or service satisfaction, including product features and options, where and how the product is sold, the sales and marketing approach, etc. A retail store owner might use cross-tab data analysis to determine customer satisfaction by looking at demographics, the gender of the person buying the product, the price of the product in a particular region, etc.
Data Clarity
There are many ways to slice and dice data and many ways in which crucial information can hide inside that data. The self-serve cross-tab reporting approach allows business users to examine relationships among data points and factors, with more clarity and accuracy. This type of analysis provides more clarity and reveals results, interdependent relationships and factors that might otherwise be missed. Users can avoid confusion when working with data and analyze large datasets to reveal frequencies and percentages. With this information, the business can understand the ‘what if’ of the various factors and see how results would change if one factor or relationship is changed.
Fact-Based Decision-Making
Self-serve cross-tab reporting simplifies analytics and allows business users to spot trends and patterns and collaborate with other team members to adapt tasks and activities to resolve issues and/or capitalize on opportunities. Using cross tabulation reporting to understand the connection and relationship between two or more factors allows the business to make a decision, with confidence. Rather than guessing the reason for declining results, increased employee attrition or other problems, the enterprise can clearly see what factors (and the relationships among factors) are the cause of a problem and how to change those factors to get better results.
‘If you can give your team easy-to-use BI tools with self-serve cross-tab reporting, you can put the power of market and customer knowledge in their hands!’
Business Intelligence solutions with self-serve cross-tab reporting can provide an intuitive, clear method of data analysis for your business users by revealing relationships in a way that makes the results clear and helps the organization to make the best decisions. By giving your team members these tools, you can leverage domain and industry knowledge and combine data analytics in a day-to-day environment without the need for assistance from data scientists or the IT staff. Self-Serve Cross-Tab reporting produces clear results that are easy to understand and can be used in staff meetings and presentations to support recommendations and help the business become more agile.
Look for seamless Business Intelligence Reporting And Flexible Tools that include self-serve Cross-Tab reporting. Provide business intelligence that your IT team can easily implement and support, and a solution that business users will want to adopt. Choose flexible, agile business intelligence solutions that can be used at all levels to collaborate, share data, and report and communicate with clarity. Self-Serve BI Tools can provide your business with the foundation to achieve your data democratization and user adoption goals.
Original Post : Cross-Tab Reporting Gives Business Users Insight Into Data!
If You Want Business Users to Embrace BI Tools, You Need to Focus on Simplicity!
If your enterprise has not already adopted business intelligence tools, it is missing a crucial benefit in competitive positioning and accurate, dependable decision-making. If your organization has implemented BI tools, but you are falling short on user adoption success, return on investment (ROI) and total cost of ownership (TCO), it is probably because the business intelligence solution is not meant to support business users.
PC Magazine says that, as business users are asked to leverage BI tools, the enterprise must focus on simplicity to engender user adoption.
‘When your team can access BI tools that support the way they work and provide meaningful views and features to easily integrate with work and business processes, user adoption is easier and more immediate.’
To achieve your enterprise goals, ensure user adoption and get the most out of your investment, you must focus on two things: user-friendly features and function and sophisticated analytics.

In this article, we list some of the considerations for business intelligence solution selection or product upgrade. This list is meant to help you assess your current solution, and/or review the capabilities of any BI tool you are considering.
Simplicity in Technology:
- 100% browser-based solution
- Intuitive interface
- Mobile application that is suitable for iOS and Android
- Simple, affordable licensing
- Rapid implementation (roll out in minutes, not months)
- Simple, multi-layered access and user rights management
- Simple architecture
Simplicity of Use:
- Ability to personalize dashboards
- KPI Reporting
- Easy-to-use reporting tools
- Collaborative features
- Social BI for sharing, ranking and commenting
- Smart Data Visualization
- Assisted Predictive Modeling
- Self-Serve Data Preparation
- Clickless analytics for easy searching and results
The business intelligence tools you select can and should include out-of-the-box, ready-to-use features that are designed to support your applications, your industry, and/or your business function. When your team can access BI tools that support the way they work and provide meaningful views and features to easily integrate with work and business processes, user adoption is easier and more immediate.
‘To achieve your enterprise goals, ensure user adoption and get the most out of your investment, you must focus on two things: user-friendly features and function and sophisticated analytics.’
Look for Ready-To-Use Tools that users will want to adopt. Provide business intelligence that your IT team can easily implement and support, with features your users will readily leverage. Choose flexible, agile business intelligence solutions that can be used at all levels to collaborate, share data, and report and communicate with clarity. Self-Serve BI Tools can provide your business with the foundation to achieve your data democratization and user adoption goals.
Original Post : BI Tool User Adoption Depends on Simplicity!
The Client is among the top five Food and Beverage (F&B) companies in India with a chain of several leading restaurant brands, and is known for being a trailblazer in its field.
The Client is the largest global manufacturer of Air Coolers. The Client is an India-based Multi-National Company with a presence in over sixty (60) countries. As the market leader, this enterprise enjoys a prime position in the residential, industrial and commercial market segments and its brand is considered synonymous with cooling products in the global market. The Client is a market disrupter in what is a diverse and poorly organized sector and it has set the market benchmark with 201 trademarks, 64 registered designs, 15 copyrights and 48 patents, thereby setting the gold standard for air cooling in the global market.
Enterprise Agility and Adaptability Are Crucial. The Right BI Tools Can Help!
Gartner research states that, ‘90% of corporate strategies will explicitly mention information as a critical enterprise asset and analytics as an essential competency.’
Whether yours is a small or a large business, your success today depends upon your agility and adaptability and those characteristics also apply to your data and your information.
If you are to build a flexible business environment, you must have tools and solutions that allow you to monitor and manage data and information and use that data to make fact-based decisions.
‘Comprehensive BI Tools should provide data analytics access for all business users and, above all, provide flexible, agile solutions that can be used at all levels to collaborate, share data and report and communicate with clarity.’
When considering a business intelligence (BI) solution, choosing a self-serve tool serves two purposes:

Support for the Organization and Users
A business can provide software and tools for users, but if those tools are not user-friendly, or if team members do not perceive their value, they will not adopt the solution into their business processes. In order to ensure that the organization can expect a good return on investment (ROI) and a low total cost of ownership (TCO), the enterprise must select a BI tool that is useful to the team and can easily be applied to satisfy the needs of their role and their responsibilities. The tools must also provide self-serve tools that offer comprehensive predictive analytics, key performance indicators (KPIs), flexible reporting, self-serve data preparation, deep dive analytics, mobile BI and social BI. This foundation will allow business users to improve data literacy and perform analytics with confidence, thereby improving fact-based decision-making.
Flexibility and Agility
When the organization selects business intelligence tools that are flexible, users can leverage personalized dashboards and customize their use to serve the needs of their role, their team and their business unit. The ability to adapt quickly by finding the root cause of a problem, spotting a trend and addressing that trend or identifying an opportunity to improve competitive advantage can provide an edge in the market and allow the organization to move quickly. Users can collaborate and share data to make decisions and recommendations and suggestions are clearly supported by data, so there is no hesitation or delay.
‘If you are to build a flexible business environment, you must have tools and solutions that allow you to monitor and manage data and information and use that data to make fact-based decisions.’
Comprehensive BI Tools should provide data analytics access for all business users and, above all, provide flexible, agile solutions that can be used at all levels to collaborate, share data and report and communicate with clarity. Simple, Self-Serve BI Tools can provide your business with the foundation to achieve your data democratization and user adoption goals. Let us help you achieve your vision and improve productivity and insight across the organization.
Original Post : Choose Self-Serve BI Tools to Support Business Success!
Key Performance Indicators and BI Tools to Support Your Business with Dynamic, Interactive Features!
There is no room in today’s business world for speculation or guesswork! Whether you are presenting to your Board of Directors, making a recommendation to your management team, or pitching a new product or idea, objective, provable results and information are required. In order to succeed in business, team members must have access to tools that allow them to establish and monitor key performance indicators (KPIs) with measurable results so that the business can adapt to change, alter and adjust activities and tasks that do not provide successful outcomes, and build on success using models that have historically proven to achieve results.
‘Take the time to select a business intelligence solution that will advance your business interests and provide clear insight and help you to measure results.’
According to recent research, businesses use one of the following methods to capture and measure key performance indicators (KPIs): Spreadsheets, Dashboards and Reporting Tools, BI and Analytical Software.
In fact, the option that is likely to provide the most success is one that will eliminate human error in data entry and calculation of formulae and metrics. That would seem to suggest that a BI and Analytical software tool is the best way to establish and manage KPIs. But the sheer volume and complexity of enterprise data, distributed across the organization can be overwhelming.

Here are some important considerations for your business that will help you to choose the right BI tools and KPI features:
- By gathering and integrating data from disparate systems and selecting a business intelligence solution that incorporates augmented analytics suitable for business users, the business can create a foundation upon which to build its success.
- When selecting a BI tool, be sure to look at the capabilities provided for managing key performance indicators. With the right approach, the enterprise can achieve measurable and clear insight into key business objectives, so you can set goals, develop strategies to achieve these goals and objectively evaluate your performance and progress.
- Look for business intelligence software that allows business users with average technology skills to define KPIs using an easy-to-use, powerful expression engine and to set polarity, frequency and threshold levels using a browser-based interface.
- Avoid static reporting that will frustrate business users and instead give them interactive tools that are dynamic and will allow them to explore, slice and dice and get to the heart of the matter. KPIs should not be limited to static monitoring.
- Choose KPI Analytics that provide interactive options to change frequencies, dimension break downs and drill down to further analyze trends, and reasons for performance and non-performance.
- Remember that KPI tools are designed to be used. If you want your users to adopt these tools and use them on a daily basis, you will need an easy way to measure results and to make adjustments to workflow, processes and activities and adjust KPIs as appropriate. This method of continuous monitoring and management ensures that users can resolve issues and capitalize on opportunities as they arise.
‘A BI and Analytical software tool is the best way to establish and manage KPIs.’
Your business management team understands the need for clear, objective metrics. Be sure you take the time to select a business intelligence solution that will advance your business interests and provide clear insight and help you to measure results, adapt to the changing market and create an environment of continuous improvement.
BI tools with Multidimensional Key Performance Indicator (KPIs) features should provide data analytics access for all business users. Simple, self-serve BI tools can provide your business with the foundation to achieve your goals. Let us help you achieve your vision and improve productivity and insight across the organization.
Original Post : BI Tools Should Have Multidimensional KPIs & Slice and Dice!
