Should My Business Choose Traditional BI or Augmented Analytics?

What’s the Difference Between Traditional BI and Augmented Analytics?

Whether you are considering a first-time implementation of business intelligence (BI) software, or you wish to upgrade your existing installation to include new features and technology, the market for BI tools and augmented analytics solutions can be confusing. Adding to the confusion are the seemingly conflicting predictions of research firms.

Gartner Predicted that, ‘Transitioning from a data-driven to a decision-centric vision is crucial. Prioritizing urgent business decisions for modeling, aligning decision intelligence (DI) practices, and evaluating DI platforms are recommended steps.’

So, will data-driven reporting, simple metrics and alerts be enough to drive your business into the future? Should your organization select a traditional BI tools, a ‘modern data quality solution,’ or review and select multiple analytics solutions to meet varying requirements across the enterprise?

‘Every enterprise has different needs, a different culture and varying business user, IT and data scientist requirements. As you review the capabilities of Traditional BI and Augmented Analytics, analyze the suite of services and functionality and compare those to the needs of your users and your organization.’

To help you answer these questions, it is important to first understand the difference between traditional Business Intelligence and Augmented Analytics.

Should My Enterprise Choose Traditional BI Tools, Augmented Analytics or Both?

Traditional BI Tools

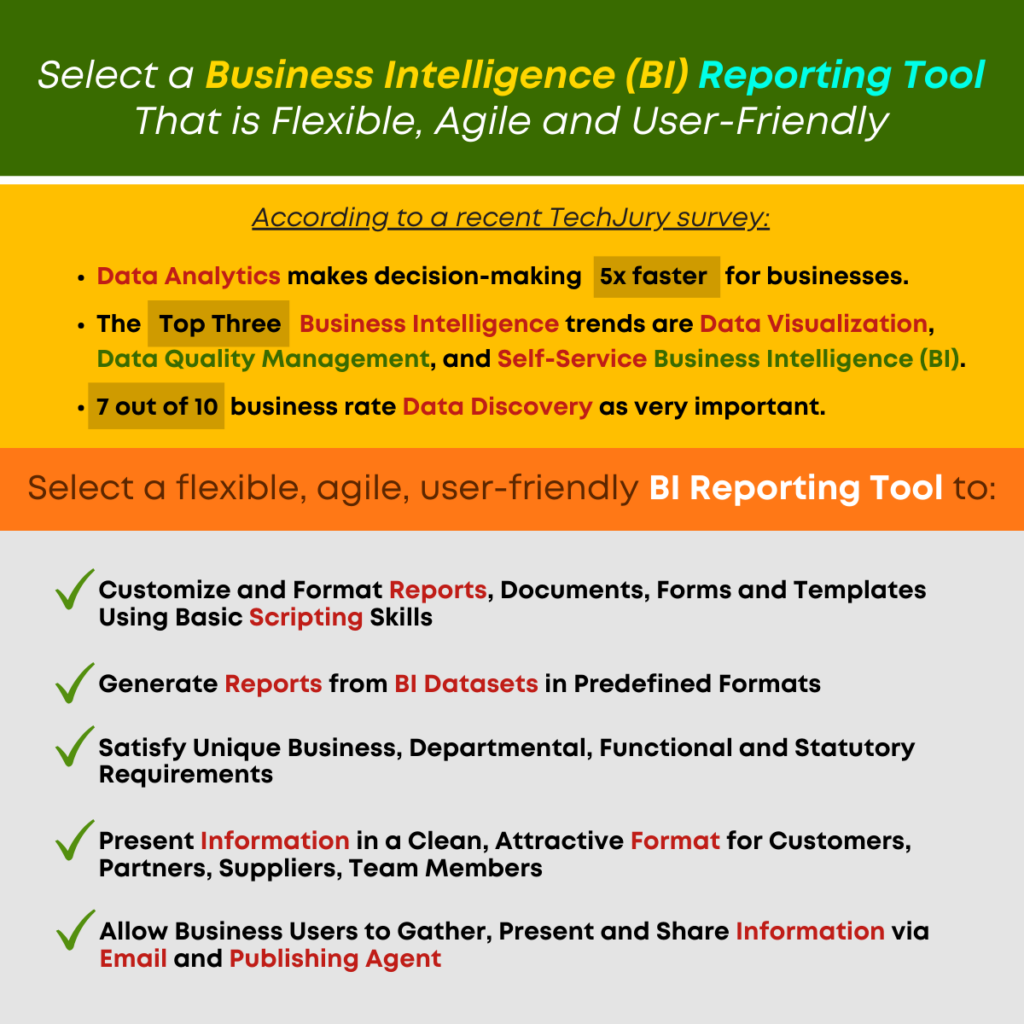
Traditional BI tools support power business users with self-serve report creation without the need for advanced technical skills, SQL skills or IT assistance. To improve accuracy and outcomes, enterprise business users who are working on day-to-day projects and activities need access to easy-to-use, intuitive tools that allow for swift, accurate action and decisions. With an integrated, mobile approach to BI tools, business users can leverage personalized dashboards, multidimensional key performance indicators, and KPI tools, report software, Crosstab & Tabular reports, GeoMaps and deep dive analytics and enjoy Social BI and collaboration.

Features include:

  • Personalized Dashboard
  • Multidimensional Key Performance Indicators (KPIs)
  • Deep-Dive Analytics
  • Social BI tools for data sharing
  • Graphical Analysis and Cross-Tab Analytics for Intuitive reporting
  • What-If Analysis to test pricing, budget and cost information
  • GeoMap support with interactive maps
  • Out-of-the-Box Mobile BI tools for access from anywhere
  • Personalized alerts
  • Real time and cached data management
  • R Integration for all with no programming experience required
  • Intuitive, informative reporting
  • Publishing and delivery agent

Augmented Analytics Solutions

Augmented Analytics solutions are designed with intuitive, sophisticated features that take users beyond basic BI tools to enable swift gathering and analysis of trends, patterns, opportunities and challenges. Augmented Analytics solutions include self-serve data preparation, smart data visualization, assisted predictive modeling and natural language processing (NLP) foundational search analytics so users can ask a simple question and get a simple answer without coding or queries. This type of solution includes key influencer analytics, anomaly detection, alerts, clickless analytics and other tools designed to support the transformation of business users to Citizen Data Scientists and to increase data literacy in the enterprise.

Augmented analytics that is designed with sophisticated features for use by team members, IT, data scientists and others, provides many advanced features and enables improved data literacy and data democratization across the enterprise. With products and modules that include self-serve data preparation and ETL for business users, predictive analytics with auto-suggestions and recommendations to help users choose the right predictive modeling techniques, and smart data visualization with recommendations for the type of visualization best suited for a particular type of data, the users can make choices confidently and gain insight into issues without the programming or data science knowledge needed in decades past. Embedded BI with integration APIs allows users to leverage single sign-on within familiar software and perform analytics from within that solution.

Features Include:

  • Sentiment Analysis
  • Assisted Predictive Modeling
  • Key Influencer Analysis
  • Clickless Analytics with Natural Language Processing (NLP) and easy ‘Google-type’ searches and queries
  • Auto Insights and toolsets that leverage machine learning
  • Anomaly Monitoring and Alerts

Features are designed to support Citizen Data Scientists and organizational transformation for Data Literacy.

‘Should your organization select a traditional BI tools, a ‘modern data quality solution,’ or review and select multiple analytics solutions to meet varying requirements across the enterprise?’

Every enterprise has different needs, a different culture and varying business user, IT and data scientist requirements. As you review the capabilities of Traditional BI and Augmented Analytics, analyze the suite of services and functionality and compare those to the needs of your users and your organization.

You may wish to implement Augmented Analytics across the enterprise and elevate data literacy and the access and use of advanced analytics across your user organization, or you may wish to focus on specific metrics, data monitoring and reporting to address unique needs or targeted goals within the organization.

Some organizations choose to leverage both the Traditional BI and the Modern BI and Augmented Analytics approach to ensure that all user and enterprise needs are addressed and avoid the one-size-fits-all approach. By giving their users, IT team, executives and business analysts the tools they need, they can align their data gathering and analytics with their strategic goals and operational objectives.

The choice is yours!

Contact Us to discuss the unique needs of your organization and your users and find out more about Smarten Technology. Explore our free article: ‘Which BI Or Analytics Tool Is Best For My Business?

BI Reporting Tools Can Make or Break Decision-Making!

Choose a BI Reporting Tool that Tells You What You Need to Know!

The ideal business intelligence and analytics solution includes traditional BI features, modern BI and analytics components and a full suite of reporting capabilities that are easy for your team to use, and will produce clear, concise results for fact-based decision-making.

According to a recent TechJury survey:

  • Data analytics makes decision-making 5x faster for businesses.
  • The top three business intelligence trends are data visualization, data quality management, and self-service business intelligence (BI).
  • 7 out of 10 business rate data discovery as very important.

‘A BI reporting tool that enables users to customize their view and approach and is easy to understand and use will make the user more productive and ensure Return on Investment (ROI).’

If you are considering a Business Intelligence or Augmented Analytics solution, be sure to select a software suite that provides your business users with personalized dashboards, multidimensional key performance indicators, and KPI tools, report software, Crosstab and Tabular reports, GeoMaps and deep dive analytics with 100% browser based interface and self-serve features that encourage and support Social BI and collaboration.

Select a Business Intelligence (BI) Reporting Tool That is Flexible, Agile and User-Friendly

By providing your team access to flexible, agile reporting tools, you increase the probability of user adoption, and improve the outcome, with reports and results that are meaningful to the user, and to the target audience of a presentation or distributed report.

Every business has unique reporting and documentation needs. Whether you are a business user or an analyst or IT professional, you use augmented analytics and BI tools in a way that is meaningful to your role. Gathering, preparing and analyzing is important but the final step in this process is equally important and that task often frustrates the user more than anything. Excel, cross-tab and tabular reporting are helpful, but those report and documentation options typically present data in columns and rows. A BI reporting tool that enables users to customize their view and approach and is easy to understand and use will make the user more productive and ensure Return on Investment (ROI).

Consider a Business Intelligence reporting tool that enables report, template and document design and configuration and supports preprinted fixed formats too. IT team members or consultants can leverage a simple, basic programming or scripting environment to define format templates and use data from Datasets and objects to produce stunning pixel perfect reports. Users can preview reports, export data to PDF files and share documents and reports via email at predefined frequency using delivery and publishing agents.

Benefits of Agile, Flexible Business Intelligence Reporting

  • Customize and Format Reports, Documents, Forms and Templates Using Basic Scripting Skills
  • Generate Reports from BI Datasets in Predefined Formats
  • Satisfy Unique Business, Departmental, Functional and Statutory Requirements
  • Present Information in a Clean, Attractive Format for Customers, Partners, Suppliers, Team Members
  • Allows Business Users to Gather, Present and Share Information via Email and Publishing Agent

‘If you are considering a Business Intelligence or Augmented Analytics solution, be sure to select a software suite that provides your business users with personalized dashboards, multidimensional key performance indicators, and KPI tools, report software, Crosstab and Tabular reports, GeoMaps and deep dive analytics.’

For out-of-the-box reporting and flexible, interactive formats, explore our full suite of reporting tools: Pixel Perfect Print ReportsBusiness Intelligence Reporting. If your organization is looking for BI Tools and Augmented Analytics that leverage advanced techniques to keep pace with changing enterprise needs and support business agility, let us help you realize your business goals and objectives with fact-based information, and flexible, scalable technology solutions that will support Citizen Data Scientist initiatives, and improved data literacy and data democratization.

Original Post : BI Reporting Tools Can Make or Break Decision-Making!

Case Study : Augmented Analytics Solution for India State Government Citizen Centric Schemes

The Client is a state government with a population of approximately 30 million citizens, and an annual budget of $5 billion USD. This government agency focuses on implementing IT and e-governance initiatives to enhance citizen services and governance efficiency. By leveraging advanced technology, the agency aims to improve the quality of life for citizens and to streamline administrative processes across and throughout departments.

Case Study : Augmented Analytics for India Construction and Infrastructure Development Company!

The Client is an India-based construction and infrastructure development company, committed to delivering quality infrastructure for private, public, and government projects. With over fifty (50) years of accumulated knowledge and experience, the organization applies its extensive resources to ensure superior infrastructure solutions.

Leverage Key Performance Indicators to Achieve Results!

Key Performance Indicators and Performance Management are Crucial to Business Agility!

When a business takes on the task of going from an opinion-based, guessing game environment to a metrics-based, fact-based environment, it must decide WHAT to measure. Metrics are fine, but deciding what is important to measure is crucial. You can measure the wrong things and end up knowing nothing about what is happening in your enterprise, and which tasks and activities are contributing to your bottom line, as opposed to the tasks that are non-productive and business processes that should be modified.

India-Based BI Tools for Every Size Business!

Advanced Analytics India! The Future is Now!

Business Intelligence in India: A Local Approach to Global Success!

India has a thriving business economy with a significant focus on technology. Whether a business plays in the technology market or is just trying to ensure that it can effectively compete in the local or global market, business intelligence is a necessary component of success. No matter how large or small the business may be, the concept of data democracy and business user empowerment is an important idea to embrace.

###

Imagine Your Perfect BI Dashboard

Flexible BI Dashboards Give Users EVERY Tool They Need

A Flexible BI Dashboard is Like a Full Box of Crayons!

What if a teacher gave a child a box of crayons with only two colors? Can you imagine the disappointment of that child when they compared their crayon box with the crayons the other children received and realized that the other children had so many other colors from which to choose?

###