
The Client is a leading electric mobility company in India, specializing in high-performance electric two-wheel scooters engineered for sustainable urban transportation. With a robust presence across 200+ cities, the organization leverages lithium-based battery technology, and advanced electric powertrain systems that are tailored to accommodate Indian road conditions.
Tag: BI Tools


The Client is a prominent engineering company in India, renowned for its extensive history. For over 160 years the Client has delivered bespoke design engineering and precision manufacturing solutions, specializing in enabling seamless motion across industries that include automotive, agriculture, marine, light construction, firefighting, and railways. The Client provides cutting-edge power solutions for critical installations and diverse applications, with expertise in fuel-agnostic engines and precision manufacturing of key engine components. It has expanded offerings in electric power train for mobility and other industrial power applications and a strengthening position in the motion control solutions space with strategic acquisitions, empowering progress across multiple sectors. The Client business is publicly traded on the National Stock Exchange of India (NSE) and the Bombay Stock Exchange (BSE) and a robust distribution network including 200 distributors, 8000 retail stores and 20,000 mechanics across India.
Why Choose BI Tools and Analytics with AI?
Today, the use of Artificial Intelligence (AI) has a wealth of potential and prospective application in the field of analytics and its integration within analytical products provides numerous benefits to the business. There are many ways in which artificial intelligence (AI) can augment the capabilities of existing analytics solutions, and provide additional insight, support and results.
World-renowned technology research firm, Gartner, predicts that ‘40% of application development teams will be using automated data science and machine learning services to build models and add AI capabilities to applications.’
True to this prediction, many business intelligence and analytics solution vendors have added AI capabilities to self-serve analytics to create an environment that encourages productivity, fact-based decisions and efficient business processes, approval processes, automated alerts, etc.
There are a number of ways that artificial intelligence can enhance and improve the features and functionality within an enterprise using the augmented analytics environment:
Business Intelligence (BI) – Artificial Intelligence can be used to analyze large datasets and to sort and present data to achieve actionable insight, recommendations and suggestions, spotting trends, providing forecasts and optimizing results.
Generative AI (GenAI) Applications – Using Natural Language Processing (NLP) and Machine Learning (ML), AI tools can create content including images, text, video and other components to enhance presentation, interact with customers and suppliers in a targeted way and personalize messages.
Analytics Tools and Techniques – Team members and end-users can leverage self-serve analytics with AI to identify patterns and trends, gain insight, present data in a way that is meaningful to a particular target audience, predict outcomes, analyze customer buying behavior and analyze performance of products, services and other operational components.
Marketing and Advertising – The organization can analyze data from disparate data sources to identify market trends, changes in targeted customer preferences, requirements for customer relationship management, and other factors that relate to competitive advantage and customer retention.
Analytics Features and Development – Vendors and solution providers can use AI to quickly and easily upgrade analytics solutions, add features and functionality and reduce development time to keep up with client and market demands.
Current Artificial Intelligence technologies like ChatGPT, GenAI, and Agentic AI all provide specific capabilities to satisfy business requirements and inform and improve analytics with data gathered from within the organization that can be repurposed, targeted and used to solve problems, identify opportunities, present data to management, partners and customers, and communicate with all stakeholders using relevant data and information garnered from within and outside the enterprise.

- Improve Data Visualization – Create interactive dashboards, graphs and charts to help users present and share data in a way that is meaningful to a particular audience, and to clearly present data for confident decision-making. It can recommend and suggest visualization techniques to improve and refine how data is presented.
- Improve Analytics with Task Automation – Automate activities and tasks, using customized automation scripts, and baseline filters and rules to extract and present data that meets user parameters. It can schedule and produce repetitive reports, and scripts can be altered change parameters, thereby freeing users to perform other operational or more strategic activities.
- Predictive Analytics – Create predictive models using self-guiding UI wizard and auto-recommendations for swift, effortless forecasting and predictive analytics using data from numerous data sources.
- Natural Language Processing (NLP) – Expand the capabilities of text generation and human language processing. It can enhance low resolution images, recognize and synthesize images and generate images for creative presentation of data and information.
- Auto Insights and Machine Learning – Automates the process of interpreting and presenting results using rich visualization techniques, and includes all salient details, so users can review, share or edit content as they please.
- Automated Alerts – Analyze results and trigger and generate alerts to protect against security violations, fraud and other risks, by analyzing normal behavior and results and comparing it to current and real-world results to identify anomalies.
- Reporting – Using visualization, graphs, images and combining those with summaries and details can provide reports and presentations that are clear and suitable for all audiences, including management and executives, as well as teams and staff members.
- Interpretation and Summarization – Quickly interpret and summarize data without spending a lot of time creating content, editing and preparing.
- Data Preparation – Improve data transformation and cleansing and help prepare data and improve the quality of that data using phonetics for clustering, identifying data types, and hierarchies, suggesting alternate values etc.
- Support for Citizen Data Scientists – Use AI cutting-edge tools to support team members with sophisticated, intuitive tools that leverage artificial intelligence (AI) and analytical techniques to produce concise results without requiring the skills of Data Scientists.
The analytical solutions market is moving quickly to adopt Artificial Intelligence and if your business wishes to succeed, it too must move to find and improve products and services as quickly as possible to meet customer expectations and to satisfy the ever-changing landscape of business competition.
Select and implement an Augmented Analytics Solution With Artificial Intelligence (AI) components to ensure affordable, flexible solutions that every user can leverage, no matter their skillset or technical capabilities. Read White Papers, ‘Generative AI (GenAI): The Benefits And Applications Of AI In Analytics,’ and ‘The Practical Use Of GenAI In Business Intelligence And Analytics Tools’ and explore the benefits of AI in analytics and the full spectrum of benefits and advantages of current artificial intelligence (AI) technologies.
Original Post : AI-Enabled Analytics and Business Intelligence Has Its Benefits!
This Client is a global telecommunications infrastructure provider, offering comprehensive end-to-end solutions for wireless network planning, optimization, and performance management. It offers services to over thirty (30) Tier 1 and Tier 2 telecom operators and Original Equipment Manufacturers (OEMs) worldwide, and excels in advanced 5G NR and LTE-A technologies as well as legacy networks. Business services include RF Planning, Optimization, Quality of Service (QoS) Benchmarking, In-Building Solutions, and skilled Manpower Deployment to provide seamless execution across diverse environments. The Client operates in more than fifteen (15) countries and spans five (5) continents.


Choose a BI Reporting Tool that Tells You What You Need to Know!
The ideal business intelligence and analytics solution includes traditional BI features, modern BI and analytics components and a full suite of reporting capabilities that are easy for your team to use, and will produce clear, concise results for fact-based decision-making.
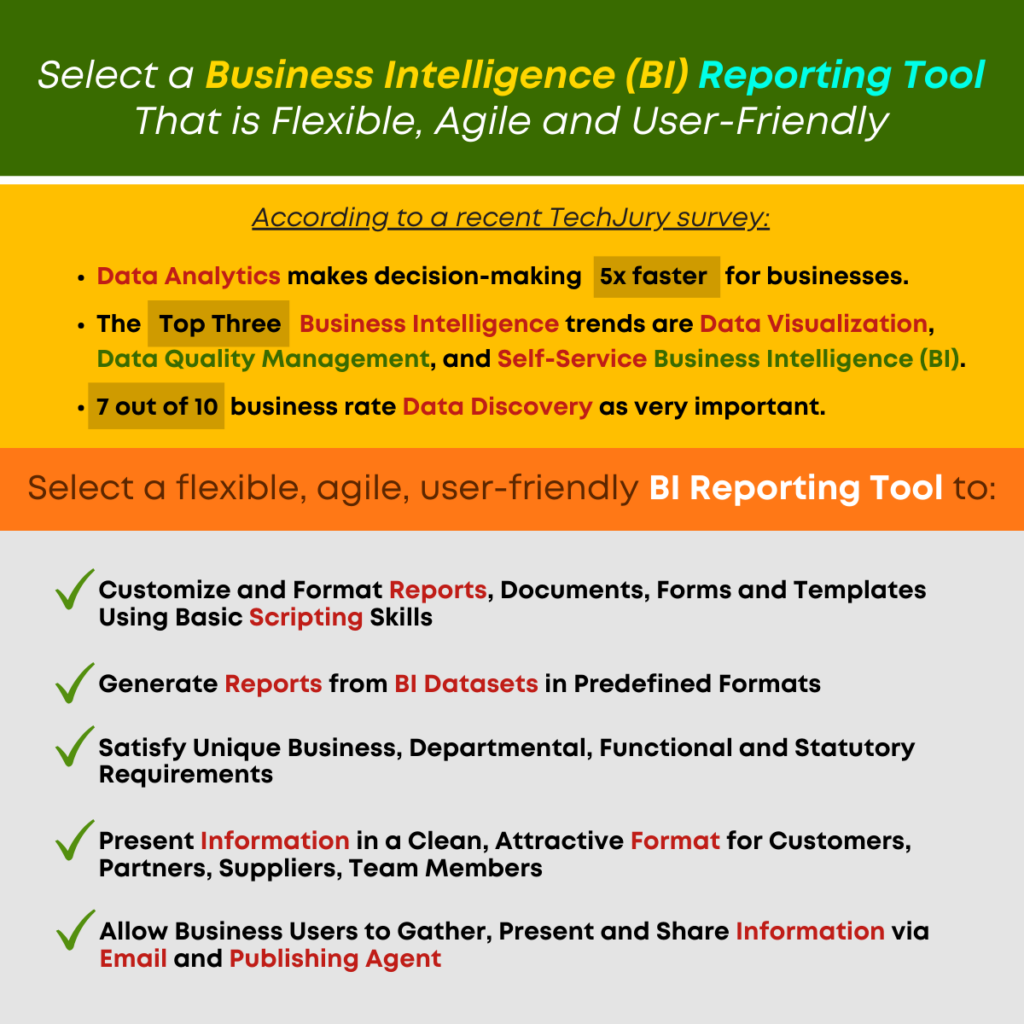
According to a recent TechJury survey:
- Data analytics makes decision-making 5x faster for businesses.
- The top three business intelligence trends are data visualization, data quality management, and self-service business intelligence (BI).
- 7 out of 10 business rate data discovery as very important.
‘A BI reporting tool that enables users to customize their view and approach and is easy to understand and use will make the user more productive and ensure Return on Investment (ROI).’
If you are considering a Business Intelligence or Augmented Analytics solution, be sure to select a software suite that provides your business users with personalized dashboards, multidimensional key performance indicators, and KPI tools, report software, Crosstab and Tabular reports, GeoMaps and deep dive analytics with 100% browser based interface and self-serve features that encourage and support Social BI and collaboration.
By providing your team access to flexible, agile reporting tools, you increase the probability of user adoption, and improve the outcome, with reports and results that are meaningful to the user, and to the target audience of a presentation or distributed report.
Every business has unique reporting and documentation needs. Whether you are a business user or an analyst or IT professional, you use augmented analytics and BI tools in a way that is meaningful to your role. Gathering, preparing and analyzing is important but the final step in this process is equally important and that task often frustrates the user more than anything. Excel, cross-tab and tabular reporting are helpful, but those report and documentation options typically present data in columns and rows. A BI reporting tool that enables users to customize their view and approach and is easy to understand and use will make the user more productive and ensure Return on Investment (ROI).
Consider a Business Intelligence reporting tool that enables report, template and document design and configuration and supports preprinted fixed formats too. IT team members or consultants can leverage a simple, basic programming or scripting environment to define format templates and use data from Datasets and objects to produce stunning pixel perfect reports. Users can preview reports, export data to PDF files and share documents and reports via email at predefined frequency using delivery and publishing agents.
Benefits of Agile, Flexible Business Intelligence Reporting
- Customize and Format Reports, Documents, Forms and Templates Using Basic Scripting Skills
- Generate Reports from BI Datasets in Predefined Formats
- Satisfy Unique Business, Departmental, Functional and Statutory Requirements
- Present Information in a Clean, Attractive Format for Customers, Partners, Suppliers, Team Members
- Allows Business Users to Gather, Present and Share Information via Email and Publishing Agent
‘If you are considering a Business Intelligence or Augmented Analytics solution, be sure to select a software suite that provides your business users with personalized dashboards, multidimensional key performance indicators, and KPI tools, report software, Crosstab and Tabular reports, GeoMaps and deep dive analytics.’
For out-of-the-box reporting and flexible, interactive formats, explore our full suite of reporting tools: Pixel Perfect Print Reports, Business Intelligence Reporting. If your organization is looking for BI Tools and Augmented Analytics that leverage advanced techniques to keep pace with changing enterprise needs and support business agility, let us help you realize your business goals and objectives with fact-based information, and flexible, scalable technology solutions that will support Citizen Data Scientist initiatives, and improved data literacy and data democratization.
Original Post : BI Reporting Tools Can Make or Break Decision-Making!
