Self-Serve KPIs Allow Teams to Manage and Adapt!

BI Tools with Self-Serve Multidimensional KPIs Enable Agility and Accuracy!

Gartner research reveals that, ‘data literacy will become an explicit and necessary driver of business value, demonstrated by its formal inclusion in over 80% of data and analytics strategies and change management programs.’ When  businesses adopt and embrace business intelligence and augmented analytics, the expectation is that the enterprise will benefit by improving data literacy as well as productivity.

But if your business wants to make the most out of BI tools and augmented analytics, it is important to choose the right solution; one that is easy to use and will provide clear results – results business users can leverage to make decisions and to plan accurately. To understand the results and whether policies, processes and tasks are effective, your organization must establish metrics, and those metrics must also be clear.

‘Key Performance Indicators (KPIs) are crucial to this feature set, as they provide critical metrics that enable the business to discover and manage results objectively and to adapt and change quickly and effectively.’

A solution that provides easy-to-use, multidimensional key performance indicators (KPIs) will allow your team to establish metrics that are unique to your needs and to your industry and market and help the enterprise understand how the business measures up in the competitive market, how well the products and services are faring with customers and whether workflow and business processes are having the desired effect.

Multidimensional KPIs Provide Easy-to-Use, Objective Metrics

Benefits of Self-Serve, Multidimensional Key Performance Indicators (KPIs)

  • When the organization gives business users the tools to establish and manage KPIs, it can become more productive. There is no waiting for the IT team or a data scientist to produce important reports, so the team can be agile and flexible.
  • Interactive KPIs provide tools to gather, analyze and measure with breakdown and dynamic frequency and slice and dice so users can focus on critical metrics and gain true insight into results. Users can leverage a powerful expression engine to set polarity, frequency and threshold levels in a browser-based interface and go beyond static monitoring to change frequencies, and dimension breakdowns and gain an understanding of performance and issues.
  • Users can establish and monitor KPIs at the individual, team, department, division, and company level and KPIs are integrated with other features to further analyze trends. Multidimensional KPIs gives business users the opportunity to monitor and manage results against goals and objectives and change processes, tasks, and activities as and when change is required.

‘When your business chooses a BI tool, it is important to choose the right solution; one that is easy to use and will provide clear results – results business users can leverage to make decisions and to plan accurately.’

If your business wishes to improve data literacy and productivity by implementing or upgrading a Business Intelligence or Augmented Analytics solution, it is imperative that you review the available modules, tools and features to ensure that the solution provides easy-to-use, sophisticated functionality that is suitable for your business users. Key Performance Indicators (KPIs) are crucial to this feature set, as they provide critical metrics that enable the business to discover and manage results objectively and to adapt and change quickly and effectively.

Choose a  Business Intelligence Reporting Solution that include Multi-Dimensional Key Performance Indicators (KPIs). Provide business intelligence that your IT team can easily implement and support, and a solution that business users will want to adopt. Choose  flexible, agile business intelligence solutions that can be used at all levels to collaborate, share data, and report and communicate with clarity. Self-Serve BI Tools can provide your business with the foundation to achieve your data democratization and user adoption goals.

Original Post : Multidimensional KPIs Provide Easy-to-Use, Objective Metrics!

What Are The Pros and Cons of Flutter App Development?

The Good and the Not-So-Good of Flutter App Development!

If you are mulling over your mobile application or a web application for mobile devices, you might ask, ‘can we use flutter for web development,’ or ‘why use flutter for app development.’

BuiltWith reports that there are over 43,000 websites currently using Flutter, and AppBrain reveals over 25,000 Flutter apps on the market today. It is clear that the consumer and the developer community see the benefits of the Flutter Development environment.

Getting Started with Flutter Development

Is It Easy to Get Started with Flutter Development?

If you are considering Flutter development for your mobile application, you may have heard about Flutter development. There is a lot to like about Flutter development for mobile apps. By some estimates there are over 25,000 Flutter applications on the market today. But before you start on your journey, as with any software development project, you will want to assess your needs, the needs of the market and your customers before you choose a development environment and start working on your mobile application.

An IT Consulting Partnership Benefits Web Agencies!

The Right IT Consulting Partner Offers Many Benefits to Web Agencies!

Web agencies have a very specific business model and that model is client-facing. There is no way for a web agency to compete, if it does not satisfy its customer needs and, equally importantly, if it does not anticipate what its customers want.

Yes! Digital Transformation DOES Improve Results

Digital Transformation Improves Results…As Reported By Businesses!

According to a survey of businesses regarding Digital Transformation (Dx), 40% of respondents reported improved operational efficiency, 35% reported that it was easier to meet changing customer expectations, 26% said Dx improved product quality, and 24% said Dx reduced product development costs.

Self-Serve Cross-Tab BI Tools Reveal Issues and Possibilities!

Self-Serve BI Tools with Cross-Tab Reporting Improve Clarity and Results!

If you are considering a Business Intelligence solution or BI tool, or if you wish to upgrade your business intelligence and reporting tools, look for a solution that has self-serve cross tabulation, or cross-tab reporting. Cross-Tab reporting reveals the relationship between two factors or targets. This analytical tool can be used for side-by-side comparisons and to compare results for one or more data points, variables, or targets.

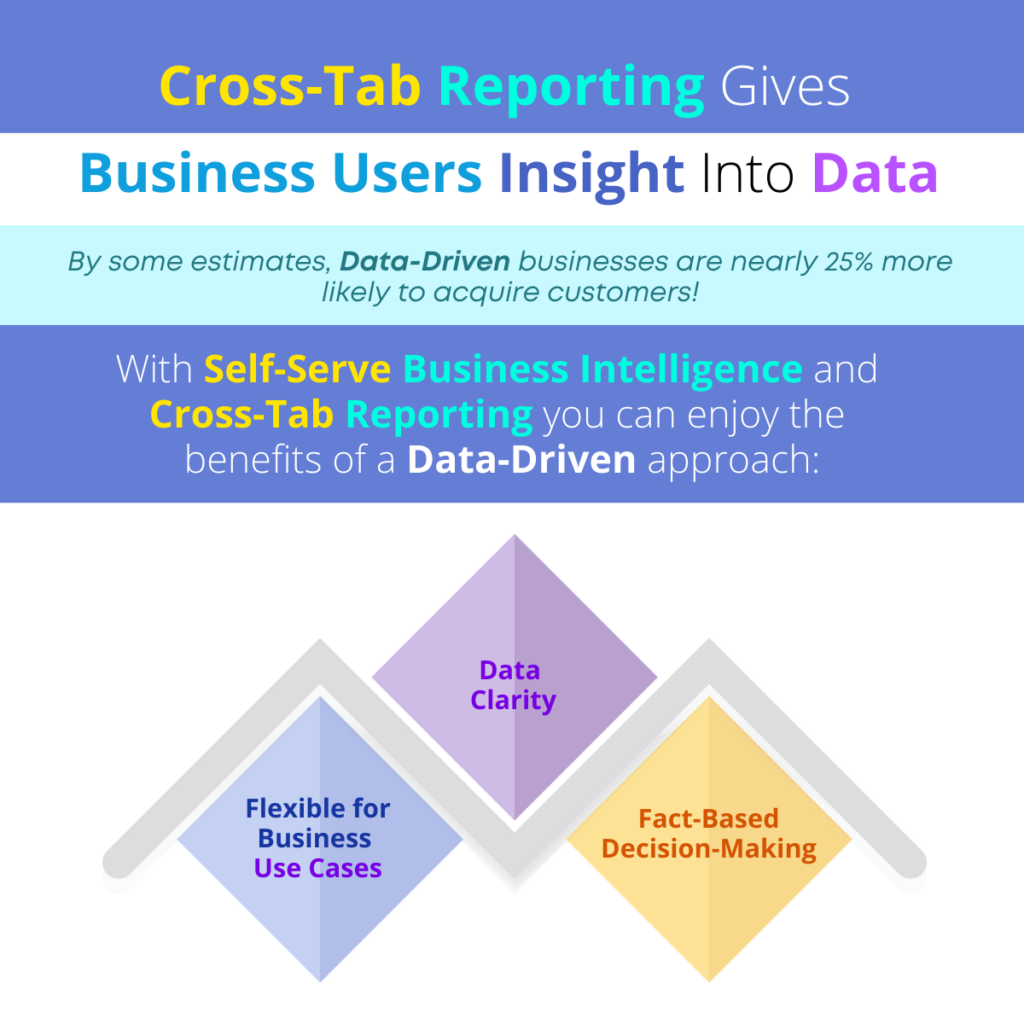
Did you know that, by some estimates, data-driven businesses are nearly 25% more likely to acquire customers? If you can give your team easy-to-use BI tools with self-serve cross-tab reporting, you can put the power of market and customer knowledge in their hands!

‘Business Intelligence solutions with self-serve cross-tab reporting can provide an intuitive, clear method of data analysis for your business users by revealing relationships in a way that makes the results clear and helps the organization to make the best decisions.’

In this article, we discuss the value of self-serve BI tools with Cross-Tab capabilities and the benefits of this type of focus and insight.

Cross-Tab Reporting Gives Business Users Insight Into Data

Benefits of Self-Serve Cross Tabulation Reporting

Flexible for Business Use Cases

Cross-tab reporting allows for intuitive use by business users with average technical skills, and can be beneficial for all types of business functions and industries. In an educational setting, a university or school might use cross-tab reporting to analyze teacher or course evaluations, looking at the relationship between student satisfaction and the subject, the class time, class location and other factors. Businesses can analyze team and employee satisfaction and attrition by looking at job location, benefits, the results of exit interviews, available training, and support, etc. Cross-tab reporting is frequently used in market research to analyze the various factors that relate to product or service satisfaction, including product features and options, where and how the product is sold, the sales and marketing approach, etc. A retail store owner might use cross-tab data analysis to determine customer satisfaction by looking at demographics, the gender of the person buying the product, the price of the product in a particular region, etc.

Data Clarity

There are many ways to slice and dice data and many ways in which crucial information can hide inside that data. The self-serve cross-tab reporting approach allows business users to examine relationships among data points and factors, with more clarity and accuracy. This type of analysis provides more clarity and reveals results, interdependent relationships and factors that might otherwise be missed. Users can avoid confusion when working with data and analyze large datasets to reveal frequencies and percentages. With this information, the business can understand the ‘what if’ of the various factors and see how results would change if one factor or relationship is changed.

Fact-Based Decision-Making

Self-serve cross-tab reporting simplifies analytics and allows business users to spot trends and patterns and collaborate with other team members to adapt tasks and activities to resolve issues and/or capitalize on opportunities. Using cross tabulation reporting to understand the connection and relationship between two or more factors allows the business to make a decision, with confidence. Rather than guessing the reason for declining results, increased employee attrition or other problems, the enterprise can clearly see what factors (and the relationships among factors) are the cause of a problem and how to change those factors to get better results.

‘If you can give your team easy-to-use BI tools with self-serve cross-tab reporting, you can put the power of market and customer knowledge in their hands!’

Business Intelligence solutions with self-serve cross-tab reporting can provide an intuitive, clear method of data analysis for your business users by revealing relationships in a way that makes the results clear and helps the organization to make the best decisions. By giving your team members these tools, you can leverage domain and industry knowledge and combine data analytics in a day-to-day environment without the need for assistance from data scientists or the IT staff. Self-Serve Cross-Tab reporting produces clear results that are easy to understand and can be used in staff meetings and presentations to support recommendations and help the business become more agile.

Look for seamless Business Intelligence Reporting And Flexible Tools that include self-serve Cross-Tab reporting. Provide business intelligence that your IT team can easily implement and support, and a solution that business users will want to adopt. Choose  flexible, agile business intelligence solutions that can be used at all levels to collaborate, share data, and report and communicate with clarity. Self-Serve BI Tools can provide your business with the foundation to achieve your data democratization and user adoption goals.

Original Post : Cross-Tab Reporting Gives Business Users Insight Into Data!

NodeJS Provides Support for Complex Cross-Platform Apps!

Hire Node Programmers for Cross-Platform Application Development!

By some estimates, Node.js is used by at least 30 million websites and is the most-used framework. Today, the Node environment is popular among developers and is often recommended for cross-platform projects. Its open-source solution is compatible with Windows, Linux, Unix, macOS and more and the back-end JavaScript environs are suitable for complex projects.

Yes! Business Users Can Love Digital Transformation (Dx)

Some Reasons Your Business Users Should Love Digital Transformation (Dx)!

When it comes to implementing a Digital Transformation (Dx) initiative, your IT team and senior executives probably don’t need convincing! Consider the recent IDC survey results about Dx: