Using LCNC in Augmented Analytics
Low-Code Development and No-Code Development have been getting a lot of press in technology publications and conferences of late. If you are interested in finding out more about this topic, and about how low-code, no-code (LCNC) can be used to enhance analytics and change the approach of the self-serve, augmented analytics market, this article will provide you with a primer.
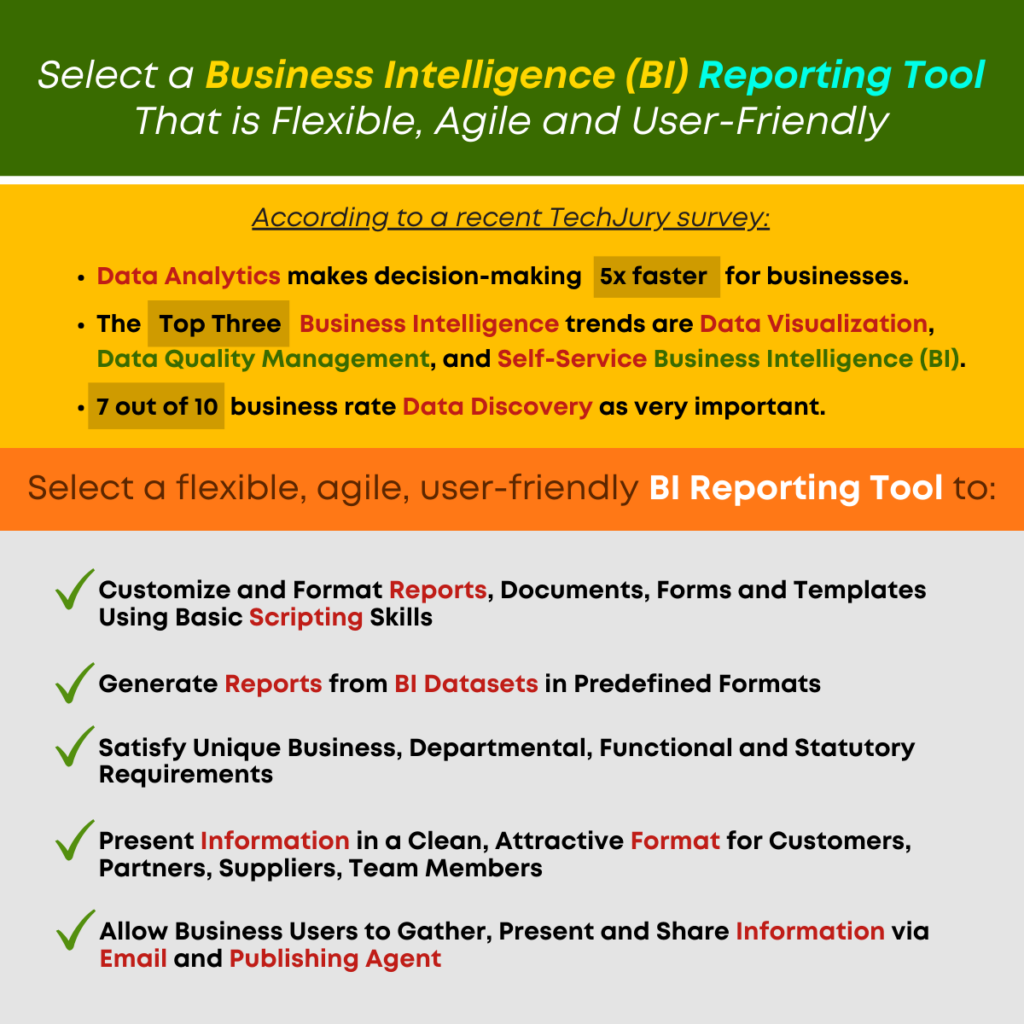
‘Including the LCNC approach in BI and analytics tools can and will support the enterprise as it moves forward, and can provide advantages and support for the future.’
Let’s begin with a Definition Of Low Code And No Code, and a discussion of the difference between Low Code And No Code Development.

Low-Code Development
Low-Code Development allows programmers and developers to quickly and easily create applications using tools that simplify the development process with drag and drop components that enable the team to add features without writing code ‘from scratch.’ This visual development approach uses a graphical user interface (GUI) to support programmers as they build applications. To understand how this benefits the development team and the business, it is important to understand how low code platform works. By enabling swift development and mitigating the use of complex code, developers can easily add features to keep pace with the market and customer needs, so upgrades and iterations are fast and easy. The low-code platform is easy to integrate with existing systems, so it will support users of popular and familiar solutions with new features that are easy to use.
No-Code Development
No-Code Development requires no coding and is used to create simple, basic applications that can be quickly deployed and upgraded. The no code environment uses a graphical user interface (GUI) that is user-friendly and easy for developers to navigate. It supports developer productivity with easy-to-use tools and is less expensive than the typical software development approach, and it is easy to customize, though it is not scalable for complex application development and will produce only limited functionality. The no-code platform is fast and easy to use and provides an additional set of tools and an approach that will support programmer productivity and get products and upgrades to market quickly.
When considering the difference between low code and no code development, here is the bottom line:
Low-Code solutions use visual development environments and automated links to back-end systems, databases, web services and APIs.
No-Code solutions utilize visual drag-and-drop interfaces and require no coding, but rather are configured and implemented quickly, using the skilled application of tools and techniques.
The top low-code platforms are easy for developers to learn and the no-code environments have a library of pre-built components from which the team can choose.
World-renowned technology research firm, Gartner, predicts that low-code development tools will account for 75% of new application development by 2026. This prediction is primarily based on what Gartner perceives as increasing pressure for businesses to adapt quickly to market and competitive trends and changes.
The global technology research firm, Forrester highlights the complexity of existing technology environs, and the importance of supporting the business with agile, adaptable tools and workforce and suggests that low-code/no-code development allows organizations to accelerate innovation and increase business agility and sustainability.
Given the recent elevated status of low-code no-code in development and low-code no-code tools, it is important to consider whether the market has responded by adopting these techniques.
According to SlashData the use of LCNC has increased from 46% to 57% over a period of eighteen (18) months, with the usage of LCNC tools estimated at:
70% Data Science
66% Machine Learning
75% Embedded Software
69% Apps and Extensions for 3rd party ecosystems
58% Mobile Apps
Many businesses have employed LCNC to step up their competitive positioning and create and innovate quickly. Examples Of Low Code And No Code Business Innovation Include Amazon, Google, Apple, Akkio, DataRobot, and Microsoft.
When we consider the use of LCNC in business intelligence (BI) tools and predictive analytics, the reason for the uptick in usage among developers and IT professionals is quite clear.
As businesses embrace data democratization and recognize the need for data literacy among team members, and as enterprises launch Citizen Data Scientist initiatives, they face numerous obstacles and challenges, including the selection of an intuitive, self-serve BI and augmented analytics solution. Finding and choosing the right solution will drive willing user adoption, improved Return on Investment (ROI) and low Total Cost of Ownership (TCO).
But the selection of the right BI and analytics solution must also include considerations for sustainability, keeping pace with team, customer and market trends and changing behaviors, and ensuring that the technology investment will serve the organization in the long term.
Including the LCNC approach in BI and analytics tools can and will support the enterprise as it moves forward, and can provide advantages and support for the future.
For a more detailed discussion of Low-Code/No-Code in Analytics, explore our complementary article, ‘The Use And Benefits Of Low-Code No-Code Development In Business Intelligence (BI) And Predictive Analytics Solutions.’
Including the LCNC approach in BI and analytics tools can and will support the enterprise as it moves forward, and can provide advantages and support for the future.’
Contact Us to find out how no code data analytics and the low code approach for business analytics can support your needs. Our Business Intelligence And Augmented Analytics solution can help your business achieve objectives. Read this free article to discover the potential of no code business intelligence software and LCNC And AI In Predictive Analytics, explore our seamless Analytics Solution Technology.
Download A Free Trial Of Smarten Analytics Software.
For a detailed discussion of Low-Code/No-Code in Analytics, explore our complementary article, ‘The Use And Benefits Of Low-Code No-Code Development in Business Intelligence (BI) and Predictive Analytics Solutions,’ ‘How Does LCNC Enhance BI and Predictive Analytics,’ ‘Choose the Right LCNC BI Tools and Predictive Analytics,’ and ‘LCNC Benefits Teams, Business Users and Citizen Data Scientists.’